Indexes Retest Critical Price Channel Resistance

News, again, drives the US stock market and major indexes higher as optimism of a US/China trade agreement floods the news wires. As we’ve been suggesting, the global markets continue to be news-driven and are seeking any positive news related to easing trade tensions and capital markets. We believe any US/China trade deal would be received as very positive news by the global capital markets – yet we understand the process of achieving the components of the “deal” would likely still be 6 to 24 months away.

Still, with the strength of the US economy and the potential that some deal could be reached before the end of 2019 setting positive expectations, the US stock market and major indexes rallied last Thursday and Friday (October 10 and 11). As the long holiday weekend sets up with no trading on Monday, it will be interesting to see what is potentially resolved between President Trump and the Chinese before the markets start to react on Sunday and Monday nights. Make sure up opt-in to our free-market trend signals newsletter.

Our research team wanted to highlight some very key elements related to technical price theory and technical analysis. These weekly charts highlight what we believe is “key resistance” in the US major indexes and share our research team’s concern that the markets may be reacting to news more than relying on fundamental economic and earnings valuations. In past articles, we’ve highlighted how a “capital shift” is continuing to take place where foreign capital is actively seeking safety and security for future returns. This leads to a shift in how capital is being deployed throughout the globe. Continue reading "Indexes Retest Critical Price Channel Resistance"

ADL Predicts Oil Prices Will Fall Below $40

There are times when our research team interprets our advanced predictive modeling systems so well that we call a move in the markets 3 to 10+ months in advance of the move actually happening. It has happened for our team of research so often lately that we are somewhat used to the accolades we receive from our followers and members. Our October 2018 Gold price predictions are still playing out accurately and continue to amaze people – even though we made these predictions over 12 months ago.

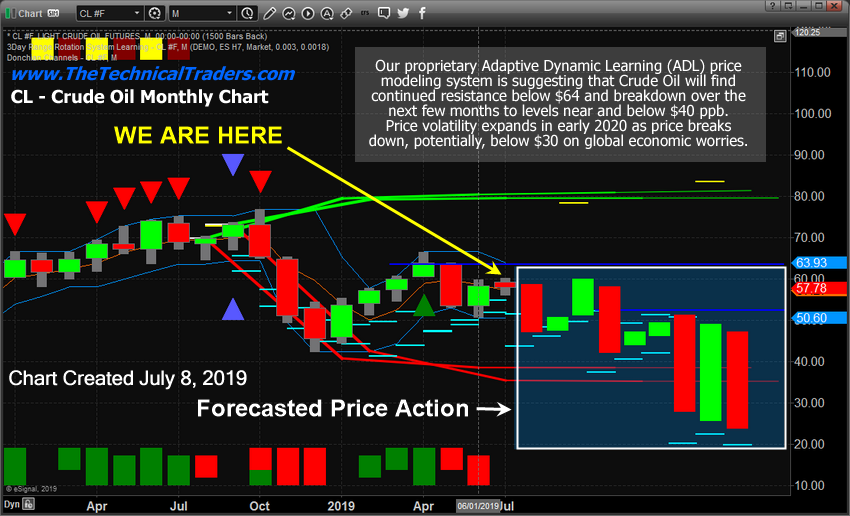
Today, we wanted to highlight our Adaptive Dynamic Learning (ADL) predictive modeling systems expectations for Crude Oil. The research post we made on July 10, 2019 (see below). At that time, we warned that crude oil was about to head much lower and that our ADL modeling system was suggesting that oil prices would rotate between $47 and $64 before breaking much lower in November 2019. Ultimately, oil prices will fall below $40 ppb following our timeline and could begin a broader downside move before the end of October 2019. Read our full prediction/research report from the link below.

Oil

SOURCE: July 10, 2019: PREDICTIVE MODELING SUGGEST OIL HEADED MUCH LOWER

We believe the support level near $50.50 will act as a temporary support level over the next 3 to 10+ days before a moderate price breakdown below this level begins. Our expectations for November 2019 are that oil prices may fall to levels below $45 ppb on a deeper downward price move, yet will recover to levels near $47 near December 2019/January 2020. Continue reading "ADL Predicts Oil Prices Will Fall Below $40"

What Should Traders Expect From Impeachment Proceedings?

News of the formal impeachment proceedings came just after the markets closed on September 24, 2019. The markets had already broken a bit lower most of the day after Consumer Confidence and Jobs expectations were weaker than expected. We had just authored a public research post about our belief that the Technology sector was about to breakdown and begin to move lower. Additionally, we pushed out a post about how Silver would become the “Super-Hero” of 2019/2020 based on our expectations of further gains.

We believe the new impeachment proceedings will result in a market that is very similar to what happened when the US invaded Kuwait in August 1990. At that time, the US launched a very fast invasion of Kuwait that prompted a massive news event and resulted in hours of new invasion video that drew millions of Americans into watching the news every night. This invasion was almost like an extended Super Bowl or an extended World Series event where millions of people are actively engaged in this event, stop engaging in the local economy and focus their attentions on the news cycle, content and political circus originating in DC. But first, be sure to opt-in to our free-market trend signals newsletter

What Does This Mean For Traders

For traders, it means we have to be prepared for just about anything. It means the news events will become even bigger drivers of market rotation and trends as well as the fact that we must prepare for weaker economic data over the next 13+ months. The impeachment process is going to be a dramatic distraction for many people and business ventures. Many will simply fall into a “protectionist” mode where new expenses, expansion and other facets of life/business will be put on hold until after November 2020 (or later).

Our research team believes the initiation of these impeachment proceedings will act as a process of muting or weakening the US economy over time. Starting out slowly at first, then gaining strength as the news cycle picks up more and more “dirt” while both sides posture and position for advantage into the November 2020 election cycle. The end result will be a decidedly weaker US economy as a result of this new impeachment process and we believe the final outcome could leave some career politicians bloodied and battle-weary. Continue reading "What Should Traders Expect From Impeachment Proceedings?"

Fed Set To Rattle Global Markets

Today is the day for the US Fed to announce their rate decision and we believe the 25 basis point rate cut is the only option they have at the moment that will attempt to settle foreign market fears and allow for a suitable “unwinding” of the credit/debt “setup” we highlighted in Part I of this research post.

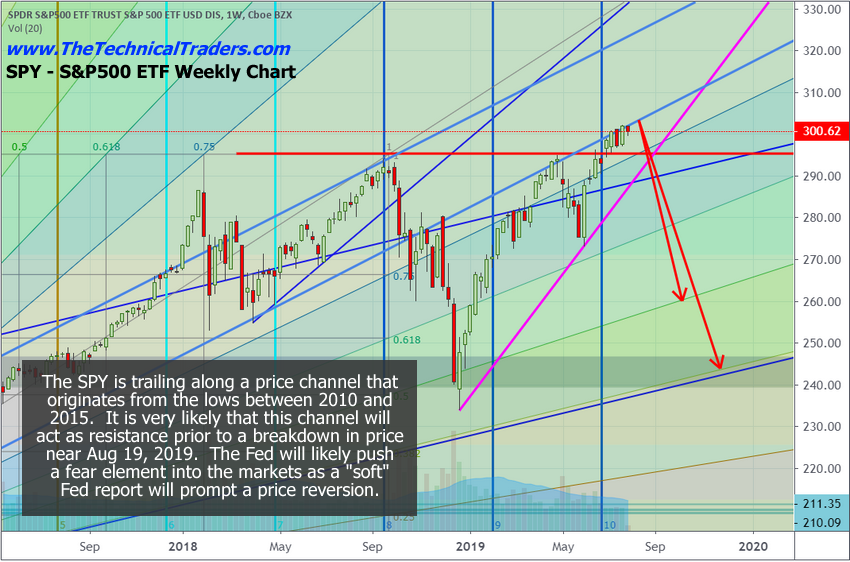
We believe out August 19 expectation of a global market PEAK and the beginning of a price reversion move is related to multiple aspects of the timing of this Fed move and the current global economic outlook. The unwinding of this debt/credit bubble will likely take many more years to unravel. Yet, right now the US Fed is trapped in a scenario they never expected to find themselves in. Either continue to run policy that supports the US economy (where rates would likely stay between 1.75 to 2.75) over the next 5+ years or yield to the global market and attempt to address a proper exit capability for this debt/credit “setup”.

We believe global investors are expecting a massive collapse in the US stock market as a reaction to this move by the Fed and because of the expectation that another bubble has set up in the US. But we believe the actual bubble is set up in the foreign markets and not so much in the US. Yes, the US markets have extended to near all-time highs and the US consumer is running somewhat lean. It would be natural for the US economy to revert to lower price levels and for the US economy to rotate as “price exploration” attempts to find true market support. Yet, our fear is that the foreign markets are much more fragile than anyone understands at the moment and that a reversion in the US markets will prompt a potential collapse in certain foreign markets.

Weekly SPY Chart

This Weekly SPY chart highlights what we expect to transpire over the next 6 to 8+ months. We believe the August 19 peak date that we predicted months ago will likely start a process that will be tied to the US election cycle event (2020) and the US Fed in combination with global market events. We believe a reversion price process is about to unfold that could be prompted into action over the next 2+ weeks by the US Fed, trade issues and global central banks.

fed

If the US Fed drops the FFR by 25pb, the fragility of the foreign market debt/credit issues is not really abated or resolved. It just allows for a bit of breathing room that may allow these foreign debtors enough room to wiggle out of some of their problems. The US Fed would have to decrease rates by at least 75 basis point before any real relief will materialize for these foreign debtors. Continue reading "Fed Set To Rattle Global Markets"

Are Real Estate ETFs The Next Big Trade? - Part 2

In part I of this research post, we highlighted how the shifting landscape of the US real estate market may be setting up an incredible trading opportunity for technical traders. It is our belief that the continued capital shift which has been driving foreign investment into US assets, real estate, and other investments may be shifting away from US real estate as tell-tale signs of stress are starting to show. Foreclosures and price drops are one of the first signs that stress exists in the markets and we believe the real estate segment could be setting up for an incredible trade opportunity.

The Proshares Ultrashort Real Estate ETF (SRS) has recently completed a unique “washout low” price bottom that we believe may become an incredible trading opportunity for technical traders. If the US Fed pushes the market into a panic mode, sellers will become even more desperate to offload their homes and buyers will become even more discerning in terms of selecting what and when to buy.

Our opinion is that the recent “washout low” price bottom in SRS is very likely to be a unique “scouting party” low/bottom that may set up a very big move to the upside over the next 4 to 12+ months. If our research is correct, the continued forward navigation for the US Fed, global central banks and the average consumers buying and selling homes is about to become very volatile.

If SRS moves above the $25.50 level, our first upside Fibonacci price target and clears the $24.25 previous peak set in April 2019, it would be a very clear indication that a risk trade in Real Estate is back in play. Ideally, price holding above the $21.65 level would provide a very clear level of support negating any future price weakness below $21.50. Continue reading "Are Real Estate ETFs The Next Big Trade? - Part 2"