Is A Real Estate Crash Coming?

Does history repeat itself? Are price patterns and chart patterns reliable enough to suggest that a global Real Estate market collapse may be set up? What would it take for another Real Estate collapse to take place in today’s global market?

First, let’s start with this simple chart highlighting the “Bear Flag” setup from 2007 and the current 2019 Bear Flag setup. This price pattern was enough of an early warning sign for our research team to run into our offices and tell us of the exciting pattern they just identified regarding Real Estate and what they thought could happen. We listened to them share their ideas and concepts of how we have 11 months to go before the 2020 US Presidential election takes place and how higher risk delinquencies and foreclosures are starting to spike. They suggested the political theater of the global markets and US election cycle will likely distract from the weakening economic cycle which could present enough “smoke and mirrors” to keep investors’ attention away from this potential collapse in the housing market.

Much like a magician attempts to distract you just long enough to pull of their new trick, could the political theater, global economic news cycles and the never-ending battle in Washington DC be just enough of a distraction that skilled traders miss this critical setup? We hope not.

The peak that occurred in 2007 setup about 19 months before the 2008 Presidential election took place. The 2019 peak occurs about 13 months before the 2020 Presidential election. In both instances, a highly contentious political battle is taking place which may distract traders and investors from really paying attention to the underlying factors of the global markets. Continue reading "Is A Real Estate Crash Coming?"

VIX Warns Of Imminent Market Correction

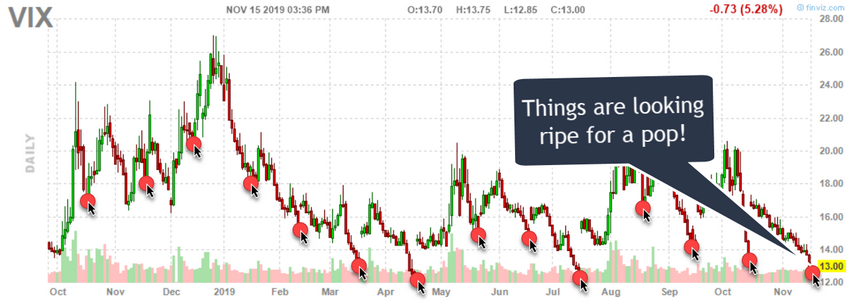
The VIX is warning that a market peak may be setting up in the global markets and that investors should be cautious of the extremely low price in the VIX. These extremely low prices in the VIX are typically followed by some type of increased volatility in the markets.

The US Federal Reserve continues to push an easy money policy and has recently begun acquiring more dept allowing a deeper move towards a Quantitative Easing stance. This move, along with investor confidence in the US markets, has prompted early warning signs that the market has reached near extreme levels/peaks.

VIX Value Drops Before Monthly Experation

When the VIX falls to levels below 12~13, this typically very low level is usually associated with an extreme peak in price. Throughout history, after the VIX has collapsed to these types of low price levels, the markets have a tendency to revert/correct in ranges that are typically in excess of 3.5% to 5.5%. In some cases, these corrections have been as large as 11% to 18% or more.

VIX
Continue reading "VIX Warns Of Imminent Market Correction"

Credit Delinquencies To Skyrocket In Q4

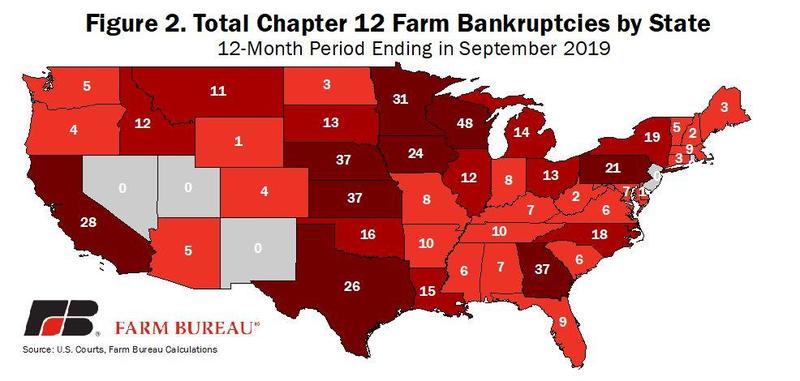
Farm delinquencies skyrocket +24% year over year as global trade issues and the ability to service credit continues to be a problem. This is a tell-tale sign that the US Fed decreased the Prime Rate recently as a result of broader credit issues related to higher interest rates for corporate and other borrowers. The last thing the Fed wants is another collapse on the lending markets similar to 2008-09.

credit
source: zerohedge.com

Low growth continues to plague the global economy as this extended run in the US stock market continues to mature. There are many questions all traders are asking – will it continue higher or have we reached a new peak in price activity? Many economists believe we are ending an expansion period related to the revaluation of the global markets after the 2008-09 credit market collapse. The typical price cycle of approximately 6~7 years has extended beyond traditional bounds and many analysts are wondering how it may end?

If an economic cycle has truly come to an end, we should expect to see some change in economic activity levels, consumer confidence and mortgage/housing activities. The end of an economic cycle is usually aligned with some moderate level of economic contraction and a slowing of economic activity. The one thing that may continue throughout this end of the mature economic cycle is the “capital shift” where capital rushes away from risk and into the US stock market as long as the reversion event stays at bay. source: zerohedge.com

Consumer Confidence levels have fallen recently to new lows. This is a very clear sign that consumers expect the economy to contract a bit based on continued trade-related issues and the overall maturity of the economic cycle. Continue reading "Credit Delinquencies To Skyrocket In Q4"

Adaptive Dynamic Learning (ADL) Suggests Volatility May Surge

Over the past few weeks and months, a number of key economic data has continued to rally the US major indexes towards new highs, hopes of a US/China trade deal, a continued shift of capital in the US markets for protection and safety, and moderately strong US economic indicators and an earning season that appears to be moderately strong for Q3 of 2019. The interesting facet of this move higher is that it is happening while trading volume has diminished dramatically in the SPY. The futures contracts, the ES, YM, and NQ, continue to show relatively strong volume activity though.

Additionally, the overnight Repo markets have risen to the attention of many skilled analysts. The concern is that the continued US Fed support of the overnight Repo facility may be a band-aid attempt to support a gaping credit crisis that is brewing just outside of view. We’ve been doing quite a bit of research over the past few weeks regarding this Repo market support by the US Fed and we believe there is more to it than many believe. We believe certain institutional banking firms may be at extreme risks related to derivative investments, shadow banking activities and/or global commodity/stock/currency/asset risk exposure. The only answer we have for the extended Repo facility at increasing levels is that the institutional banking system is starting to “fray around the edges”. Thus, we believe some larger credit risk problems may be just around the corner.

Our longer-term analysis continues to suggest that “all is fine – until it is not”. Our belief that a capital shift that has been taking place over the past 5+ years where foreign capital continues to pour into the US markets is driving US stock market prices higher. There is evidence that the capital shift into the US has slowed over the past 5+ months, yet one would not notice this by looking at these longer-term charts. The point we are trying to make today is that price peaks near current highs have, historically, been met with strong resistance and collapsed by 8 to 15% on average. Continue reading "Adaptive Dynamic Learning (ADL) Suggests Volatility May Surge"

Revisiting "Black Monday - 1987" - Oct. 19, Part 1

Back in the day, for those of you that are old enough to remember and have experienced one of the most incredible trader psychology driven stock market decline in recent history.

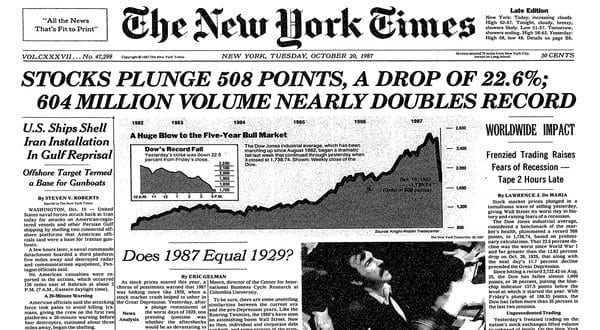
The difference between “Black Monday” and most of the other recent stock market declines is that October 19, 1987, was driven by a true psychological panic, what we consider true price exploration, after an incredible price rally.

It is different than the DOT COM (2001) decline and vastly different than the Credit Market Crisis (2008-09) because both of those events were related to true fundamental and technical evaluations. In both of those instances, prices have been rising for quite some time, but the underlying fundamentals of the economics of the markets collapsed and the markets collapsed with future expectations. Before we get too deep, be sure to opt-in to our free-market trend signals newsletter.

Our researchers believe the setup prior to the Black Monday collapse is strangely similar to the current setup across the global markets. In 1982, Ronald Reagan was elected into his second term as the US President. Since his election in 1980, the US stock market has risen over 300% by August 1987.

Reagan, much like President Trump, was elected after a long period of US economic malaise and ushered in an economic boom-cycle that really began to accelerate near August 1983 – near the end of his first term. The expansion from the lows of 1982, near 102.20, to the highs of 1987, near 337.90, in the S&P 500 prompted an incredible rally in the US markets for all global investors.

Black Monday

This is very similar to what has happened since 2015/16 in the markets and particularly after the November 2016 elections when the S&P500 bottomed near 1807.5 and has recently set hew highs near 3026.20 – a 67.4% price rally in just over 3 years. Continue reading "Revisiting "Black Monday - 1987" - Oct. 19, Part 1"