Has The Equities Waterfall Event Started?

Or is this a buying opportunity? Over the past 5+ days, a very clear change in market direction has taken place in the US and global markets. Prior to this, the US markets were reacting to Q4 earnings data and minimizing the potential global pandemic of the Coronavirus. The continued “rally to the peak” process was taking place and was very impressive from a purely euphoric trader standpoint. Our researchers found it amazing that the markets and the Dow Jones Industrial Index continued to rally many weeks after the news of economic contraction and quarantines setup in China/Asia.

Make sure to opt-in to our free-market trend signals newsletter before you continue reading this or you may miss our next special report!

We believe a number of critical factors may have pushed global investors away from their comfortable, happy, bullish attitude over the past 5+ days – most importantly the reality that the virus pandemic was very real and would continue to result in a more severe global economic contraction process and the outcome of the Caucus voting where Bernie Sanders appears to be leading almost every early voting event. There are now two major concerns hanging over the global markets and the future of the US 2020 Presidential elections. These two major issues may be enough to change investor sentiment and present a very real volatility event.

Uncertainty breeds fear and can cause traders to move away from risk. We discussed these topics in research posts many months ago. Continue reading "Has The Equities Waterfall Event Started?"

2020 Stock Market - What To Expect

Quite a bit has changed in the global markets and future expectations over the past 4+ weeks. Q4 2019 ended with a bang. US/China Trade Deal, US signing the USMCA Continental Free Trade Agreement, BREXIT and now the Wuhan Virus. On top of all of that, we’ve learned that Germany and Japan have entered a technical recession. As Q4-2019 earnings continue to push the US stock market higher – what should traders expect going forward in 2020?

Volatility, Sector Rotation, and Continued US Stock Market Strength.

Our researchers have been pouring over our charts and predictive modeling tools to attempt to identify any signs of weakness or major price rotation. There are early warning signs that the US Stock Market may be setting up for a moderate downside price rotation within the first 6 months of 2020, but we believe the continued Capital Shift that has been taking place over the past 24+ months will continue to drive foreign investment into the US and North American stock markets for quite a while in 2020 and 2021.

The interesting component to all of this, which should keep investor’s attention and really get them excited, is the chance that some type of foreign market disruption may take place in 2020 and 2021. There are a number of things that could potentially disrupt foreign market expectations.

First on the list is this virus event in China (that seems to be spreading rapidly). Second would be the news that Japan and Germany have entered a recession. Further down the list is the very real possibility that many Asian and foreign nations could see a dramatic decrease in GDP and economic activity throughout much of 2020 and 2021.

It is far too early to make any real predictions. Still, traders need to be aware of the longer-term consequences of global markets entering a contraction phase related to a confluence of events that prompts central bank intervention while consumers, financial sectors and manufacturing and industrial sectors are pummeled. Imagine what the global markets would look like if Continue reading "2020 Stock Market - What To Expect"

My Big Trend Analysis For Silver Investors - Part 2

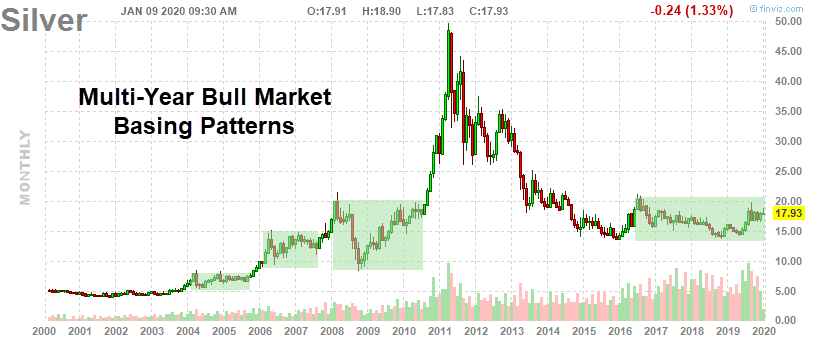
This, the second part of our Silver research article suggesting Silver may be forming a massive price base in preparation for an explosive upside move, will continue from Part I of this research series.

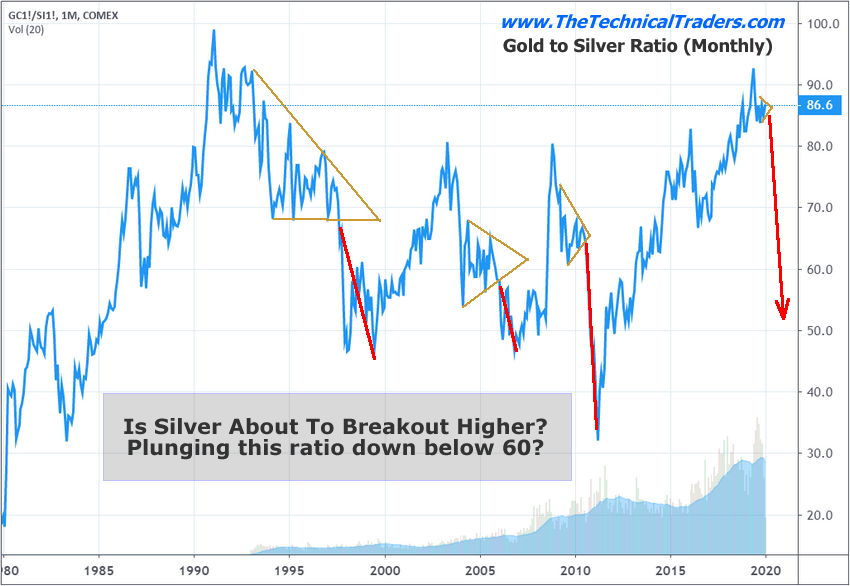
Our research team believes Silver is setting up in a price pattern that may already be “ripe” for an explosive upside move. Our researchers have poured over the data and believe the disparity between Gold and Silver is already at excessive levels.

Historically, anytime the disparity between Gold prices and Silver prices (rationalized into comparative Gold price levels) breaches 30% to 60% and Gold begins an upside price advance, Silver typically begins to move higher with 4 to 8+ months. This setup pushes the Gold to Silver ratio back below 50 or 60 as Silver rallies substantially higher, and faster than the price of Gold.

Comparatively, Silver continues to trade within a sideways price range after basing in early 2016. This price range has been fairly consistent between $14.50 and $21.0. With Gold recently starting to move higher because of the US/Iran military conflict, this raises an early warning flag for our research team because Silver has continued to trade below $18 – and well below recent highs near $20.

The price disparity between Gold and Silver is currently greater than 200% based on our proprietary modeling system. Remember, anytime this disparity level is greater than 30% to 60% and Gold breaks out in a rally, Silver will break to the upside within just a few months.

Silver Gold

The second stage rally in Silver, the real money-maker, will come when investors pile into Silver and Silver Miners as the breakout in Silver becomes explosive. The time to get into this trade is/was now or 4 months ago. Still, there is plenty of opportunity for skilled traders right now because the breakout move in Silver and Silver Miners has not really begun yet. Continue reading "My Big Trend Analysis For Silver Investors - Part 2"

My Big Trend Analysis For Silver Investors - Part 1

Everyone seems to be focused on Gold recently and seems to be ignoring the real upside potential in Silver. With all the global economic issues, military tensions, geopolitical issues, and other items continually pushed into the news cycles, it is easy to understand why traders and investors may be ignoring Silver.

Silver has really not started to move like the other precious metals. Gold is up over 45% since 2016. Palladium is up over 350% since 2016. Silver is up only 29% since 2016. The Gold to Silver ratio is currently at 86.7 – very near to the highest level on record going back over 25 years.

Silver

Historically, Silver rallies 6 to 12+ months after Gold begins a price rally. The big break in the Gold to Silver ratio comes at a time when Gold rallies by more than 30% to 60% faster than the price of Silver. In other words, when a major disparity sets up in the price of Gold compared to the price of Silver, then Silver explodes higher – which results in a drop in the Gold to Silver ratio. Continue reading "My Big Trend Analysis For Silver Investors - Part 1"

Current Equities Rally Similarities To 1999

Euphoria is a type of market rally where valuations, real market expectations, and global market concerns are pushed away from view while a trader based rush to rally takes place. One of the clearest examples is the 1995 to 2000 DOT COM US stock market rally. As the Internet burst into homes and businesses across the world, the US-led the way with dozens of new Internet-based IPOs touting glorious expectations, potential earnings and more. Everyone had the idea this new medium would dramatically change the economy for the better and breakthrough traditional economic boundaries.

The rally that took place in 1995 through 2000 was incredible. The S&P 500 rallied from 463 to 1535 – +235.57%. What we find interesting is the “price wave formation” that took place within that rally. There were a number of key price rotations that took place as the market continued to rally, we’ve labeled them A, B, and C. The first rotation, A, took place in July~Dec 1997. The second, B, took place from May 1998 to November 1998. The last, C, took place between January 1999 and November 1999. Technically, these rotations are significant because they represent “true price exploration” related to price advancement. The price must always attempt to identify true support/resistance levels while trending.

When we compare the rally from 1995 to 2000 with the current rally in the US stock market, we can see a defined level of euphoric price advance after the 2016 US elections. We must also pay attention to the previous price advance from the 2009 price lows as the global markets were struggling to recover from the Credit Crisis. Our research team identified the A, B, C rotations in the current price and associated them to the similar rotations in the 1995-2000 price rally as “key components of the current rally and a potential warning sign of a pending top formation”.

Our researchers believe the QE processes of the global central banks have set up a similar type of euphoric price rally in the current global markets even though current economic metrics are warning of weakening economic activity and weakening global market output. The US Fed and global central banks seem to want to keep pumping money/credit into the global markets to keep the rally going – most likely because they are fearful of what a crash/correction may do to the future growth opportunities around the planet. Continue reading "Current Equities Rally Similarities To 1999"