Copper Update: This Is How I Would Trade This Sell Setup

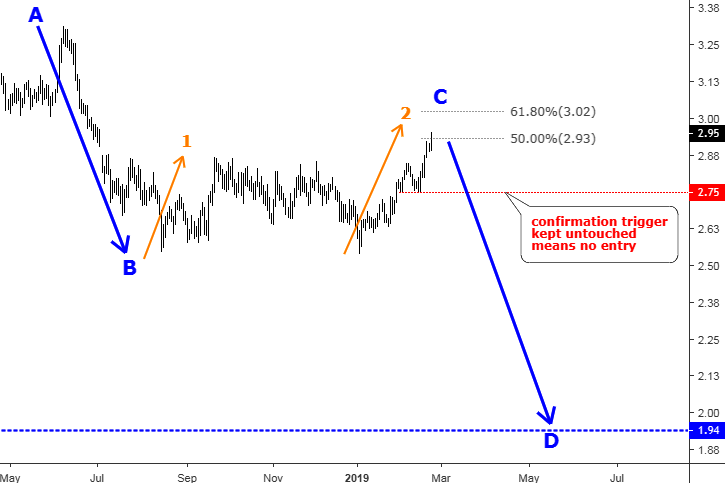
Two weeks ago I put the spotlight on copper as I found there was a nice trading opportunity in the making. The trigger for the short trade was set at the $2.75 (below minor low) to avoid emotional trading or simple guessing, and it paid well as the price dipped from the $2.84 area and stopped 2/10 of the cent above the preset trigger. Then the price reversed much higher as I expected as it should retest the former top of $2.87 before it finally goes down.

We call it a trade setup. Before that, we had an idea, which was based on some kind of analysis. So, converting good ideas into profitable trades makes us better traders. Add patience, discipline and some sort of trading strategy to get consistent profits. Otherwise, a good idea could remain to be just a good idea without pleasant outcomes for us.

Let me show you in this post how I would trade this copper idea on the short side step by step.

Step 1. Chart Analysis: Copper Futures Daily,
Copper
Chart courtesy of tradingview.com
Continue reading "Copper Update: This Is How I Would Trade This Sell Setup"

Copper Gives Bears Another Chance

Last July I posted a monthly chart of copper futures to show you that the earlier move up had been completed when the price hit the accurately predicted $3.32 level and we have entered a bearish mode.

The big short game was set between the $3.32 and $1.94 extremes. The earlier post was calling for the price of copper to retest the former valley of $1.94. Below are the poll results with your expectations recorded in July of 2018. Again, I am very thankful for your stable activity!

Copper

The majority of you agreed with my opinion that the copper could revisit the former low of $1.94. 2018 finished at the $2.64 mark, which is far away from the target and below I will show you why and what could be the next for copper. Continue reading "Copper Gives Bears Another Chance"

How Far Could Crude Oil Go?

The price of crude oil closed above the earlier top of $54.6 last Friday to confirm the reversal to the upside. So, is it the right time to find out how far we can go with it?

At the end of last May, I posted an early warning of the imminent crash of crude oil price amid the mass media euphoria from the dream of the $100 price tag per barrel, which was a good contrarian indicator. The price of WTI finally dropped last October after it broke long-term support.

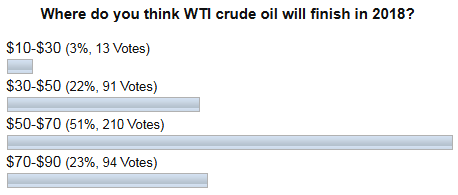
I am very grateful to you as you were very active on the poll where I asked you to share your expectations about the crude oil price by the end of 2018. Below are the results of it.

wti crude oil futures

As we can see most of you were ready for the drop of the oil price in the next lower range between $50 and $70 marks, although there were oil optimists in second place, who bet on the price to be in the $70-$90 range. Only those whose bets ranked the third ($30-$50) turned out to be right as oil finished the previous year at $45.8 after hitting the $42 area the day before Christmas.

In this post, I would like to show you some historical similarities, which could help us to understand how deeply the current pullback could go. Let’s start with the bigger chart. Continue reading "How Far Could Crude Oil Go?"

Silver Update: 1980s Vs. The 2010s

Silver surprised us with a strong Santa Claus Rally. It woke up like an ancient volcano and with a booming eruption. Before that, we proclaimed silver to be dormant compared to a vigorous rival, gold.

Everything changed at the end of 2018 as gold gained 10% from the lows and a weak silver tried to catch up to make the same profit at the very end. Bargain hunters couldn’t pass by this clear market distortion and took their chance to book a nice profit of around 4%.

In my earlier post I updated the medium term gold chart for you. Last time I updated the big chart of silver in October, which was titled dramatically “Fly Or Die” as submissive behavior of silver was leaving less and less hope for investors.

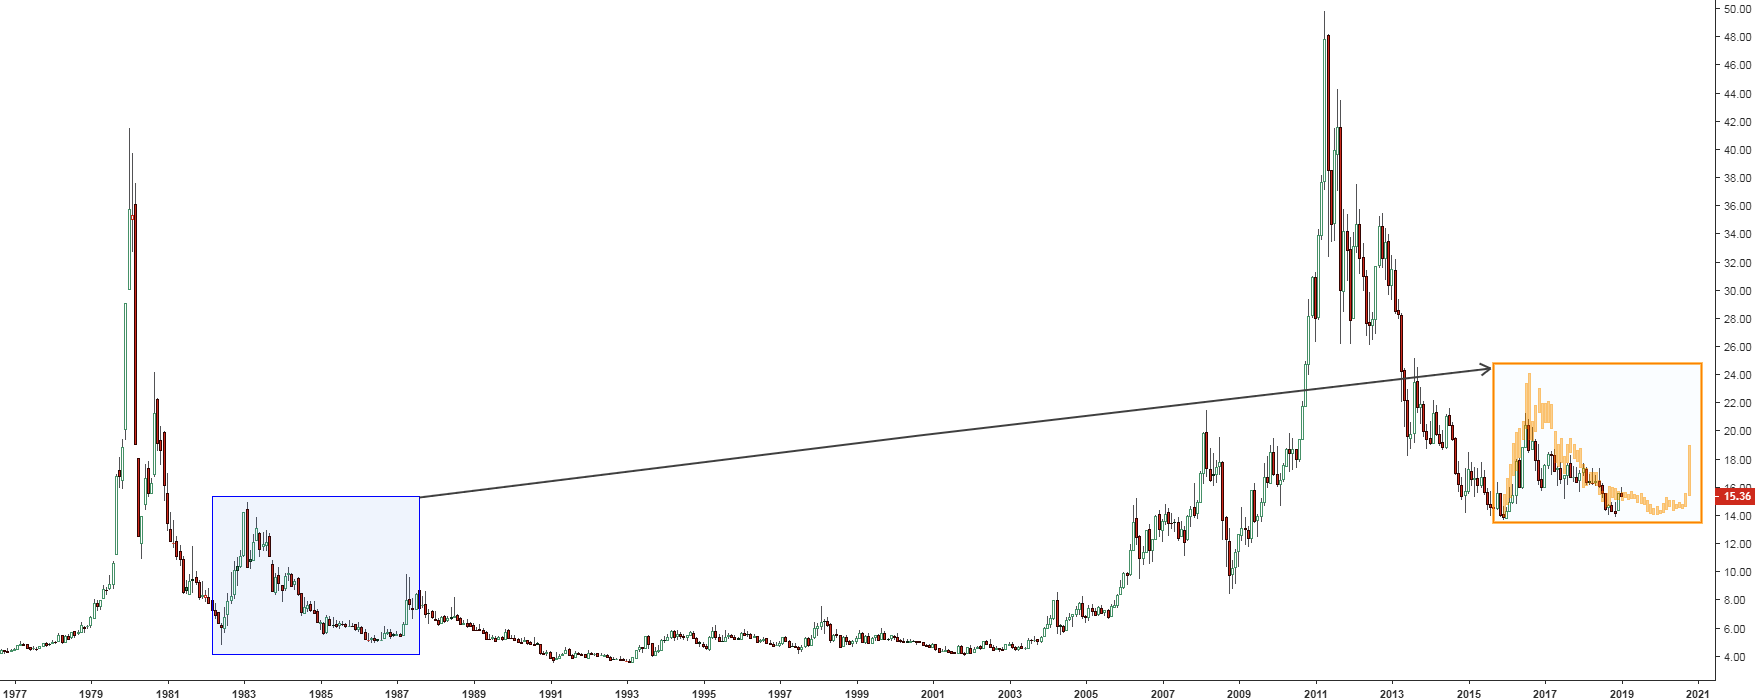
This time I am going to update the silver chart, but using a different approach. You are already familiar with it as I used historical clones with gold and silver before. The latter one was successful. This time it will be extended as I will use two clones instead of one from different historical periods so you can choose.

Let’s start with the distant one.

Chart 1. Silver Futures Monthly: Echo Of the 80s

Silver Update
Chart courtesy of tradingview.com

This chart was built in a high resolution, and I recommend you to click on it to open in a new window to see a larger image in details, especially in the right clone (orange box). Continue reading "Silver Update: 1980s Vs. The 2010s"

Gold Update: This Move Is Too Big To Ignore

Every year ahead of Christmas I traditionally ask your opinion about the possible Santa Claus Rally in the precious metals market. Last time it was on the 10th of December. In that post, I shared my worries about the possible Grinch effect of the emerging strength of the US dollar (DXY index), which could spoil the rally at the end of the year.

Most of you believed that the Santa Claus Rally would happen despite the possible threat from the dollar’s strength. And like many times before you were absolutely right as both metals gained at the end of the year – gold’s price surged $50, and silver’s price jumped more than $1. Tremendous gains, bravo!

At the start of the New Year, I would like to update the medium term gold chart for you. Continue reading "Gold Update: This Move Is Too Big To Ignore"