Crude Oil Hits The Target Early

Back in February, I wondered: “How Far Could Crude Oil Go?” As this commodity confirmed the upside reversal breaking above $54.6. We are still living in a “PetroWorld” therefore the price of oil is crucial, and it impacts all of us around the globe. So, we should watch it carefully.

I spotted a structural similarity on the weekly chart, which was cloned and applied to the current pullback of oil price on the lower time frame daily chart. The price target was set at the $63.7 and the time goal was set on the 6th of May, 2019.

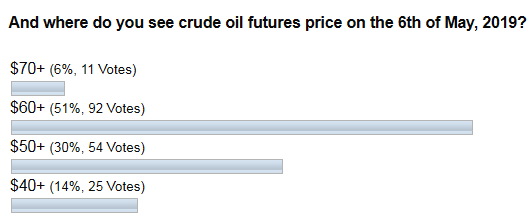
Before we move on to the updated daily chart, I would like to show you the results of your ballot on this topic.
oil price

I can’t express all my gratitude for your voting activity and support of my experiments. The results in the diagram above show that you also saw the area above $60 as a target for the current pullback. It is yet early to say if the price has topped already, but our initial target was achieved and even was passed over ahead of time.

In another ballot, you voted for the instruments you liked the most. Continue reading "Crude Oil Hits The Target Early"

Copper Trade: Stopped Out

A month ago I got the short entry trigger in the copper futures. The idea started to emerge this February, and I was watching copper closely from that time and posted updates for you. And you witnessed how I moved entry triggers higher and higher until the price has finally pushed below the last one. And this was the true benefit of avoiding simple guessing to wait for the signal.

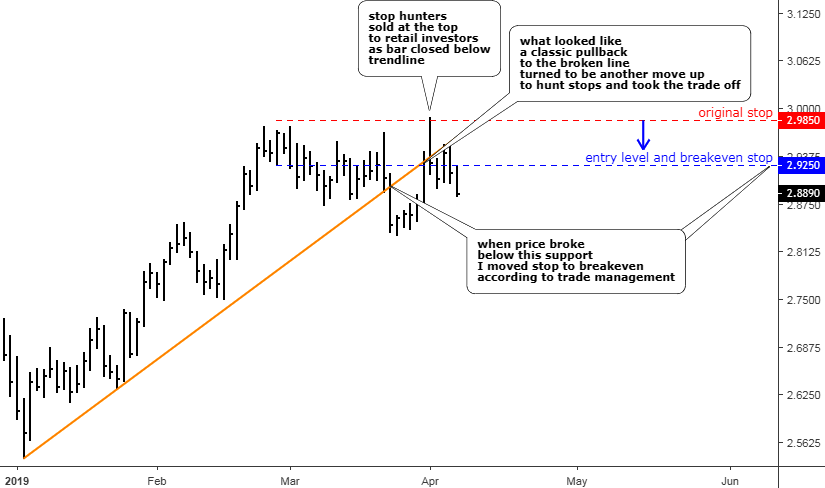
In the chart below I would like to show you how that trade was managed and what the outcome was.

Copper Futures Daily Chart: Walked Away Without A Scratch

price of copper
Chart courtesy of tradingview.com

The price of copper showed great volatility around the entry level (blue line) moving within a 10 cent range between $2.87 and $2.97. This happens due to a clash of opposite market forces at the extreme levels. Finally, the bears took the ball and pushed the price not only below the range but also below the crucial orange trendline support. Copper has hit the one month low at the $2.8345 on the 25th of March. At that stage, the short position had a profit of 3%, and I moved the stop to breakeven to enjoy the safe ride. This is a part of trade management as we should try to avoid risks as much as we can because we cannot control the market; we can only control ourselves and manage our risk. Continue reading "Copper Trade: Stopped Out"

Gold Update: Reversal Pattern Emerges

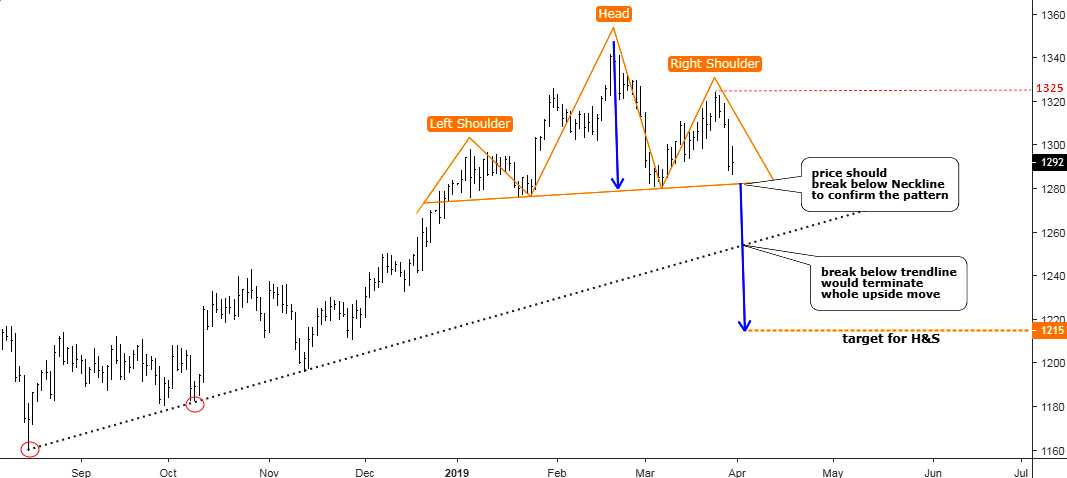
Last time I updated the gold chart at the beginning of the year I focused on the long-term consolidation, which has started at the end of 2015 and has a tricky structure as all corrective stages do. I shared with you the three most feasible options of structure development.

The first one implies the straight move up beyond the former top of $1375 (blue labels), it took only 22% of your likes. The second option, which you liked the most (48%), offers triangular consolidation (green labels). The third alternative (red labels) gained 30% of your support, and it could bring gold back down to retest $1122 area before it goes up.

I am proud to have such smart readers of my posts as most of the time you accurately predict the market behavior as last time you did it with a Santa Claus rally of precious metals. These days I spotted one notorious pattern, which could terminate the first option, which collected the least support from your voting, that amazes me again and again.

Gold Daily Chart: Possible Head And Shoulders Pattern

LLLL
Chart courtesy of tradingview.com
Continue reading "Gold Update: Reversal Pattern Emerges"

Palladium Pushed Platinum To Record Low

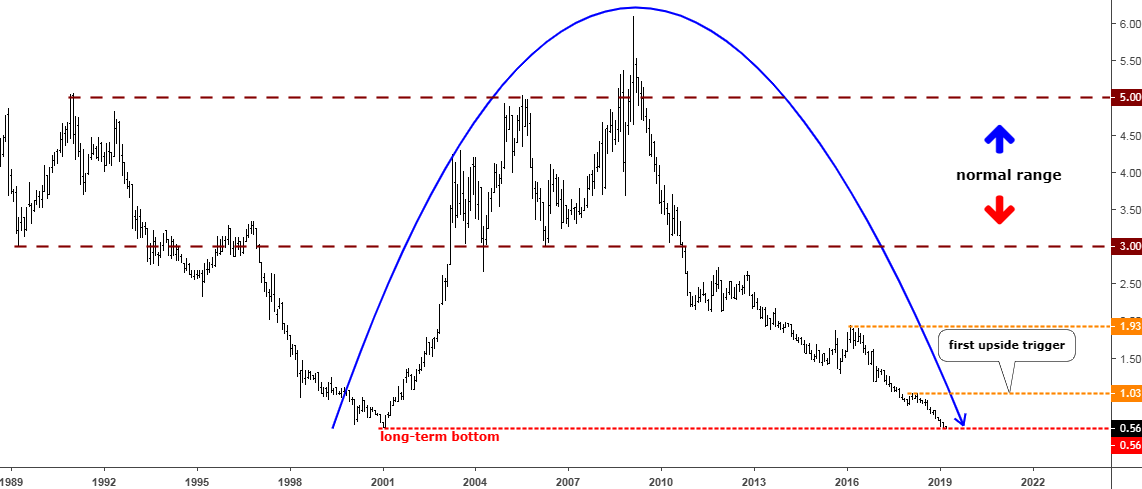
A year ago I wrote about the platinum/palladium ratio as it was on the edge, and there were two possible options, to restore the historically normal supremacy of platinum (target 1.93 oz) or to prolong the triumph of palladium (target 0.56 oz.).

This month the Platinum/Palladium ratio hit a new record low of 0.55 oz. amid the rocket move to the upside in the palladium market; the latter became the most precious metal beating gold. Let’s take a look at the big picture below.

Chart 1. Platinum/Palladium Ratio Monthly: New Record Low

platinum/palladium ratio
Chart courtesy of tradingview.com

The chart above starts with a robust growth to the upside from 3 to 5 oz. and this move had set the “normal” range for the fluctuations of the ratio within the next two decades. It was interrupted only once in 1997 when the ratio fell out of the range and quickly dropped to establish a previous record low of 0.56 oz. in 2001 amid rumors that Russia would ban palladium export. It was a textbook example of a “sell rumors - buy facts” market behavior, the ratio was down on rumors and then when the reality didn’t confirm it the ratio quickly returned to the normal range making a beautiful V-shape pattern. Then the ratio had spent another decade in that range. Continue reading "Palladium Pushed Platinum To Record Low"

Copper Triggered A Short Entry

So, dear traders, our patience was finally rewarded last week. Copper has provided us an even better opportunity as the price climbed higher to make a deeper retracement and the distance of the drop is now even greater. We started from the $2.75 level, then we moved higher to $2.885, but none of them were activated.

I spotted the famous reversal pattern on the chart, which adds to my structure analysis and I will show it in the chart below.

Let’s go through the trade setup steps again as the entry signal was triggered.

Step 1. Chart Analysis and Step 2. Trading Idea

These steps can be skipped as we already know what we are looking for.

Step 3. Trade Setup

We should prepare a Sell Setup to enter the trade using specific entry, stop and take profit levels. These are the things that make a trade. If you don’t have all three levels in your mind, you better avoid trading as it would become mere gambling. Continue reading "Copper Triggered A Short Entry"