Restless Bitcoin Makes Fiat Elite Sleepless Again

A year ago, “Bitcoin was at a crossroads” as then I spotted a triangular consolidation on the chart. The price could go both upside and downside, and I marked them as “Revival” and “Oblivion” areas accordingly. Below are your bets for the future of Bitcoin a year ago.

Bitcoin

Crypto enthusiasts are in the majority, although haters scored a hefty 41%. This violent confrontation shows that Bitcoin again threatens the interests of the elite as there are a lot of people, including President Trump, who expresses their opposition to cryptocurrencies as a whole. And it’s a natural course of things as human beings often reject changes and the elite try to shield their ultimate position.

Bitcoin broke both the downside of the triangle and the bearish confirmation level at the $6400 entering the “Oblivion” territory. The bearish target of $1250 had not been reached as the price of crypto gold had reversed ahead of $3000 notch. So, the first move was to the downside, and those of you who chose the “Oblivion” option was right.

This year Bitcoin entered the “Revival” area. It’s time to update the chart, and I am going to start with the monthly time frame. Continue reading "Restless Bitcoin Makes Fiat Elite Sleepless Again"

Gold Update: Pitfall Or Pit Stop?

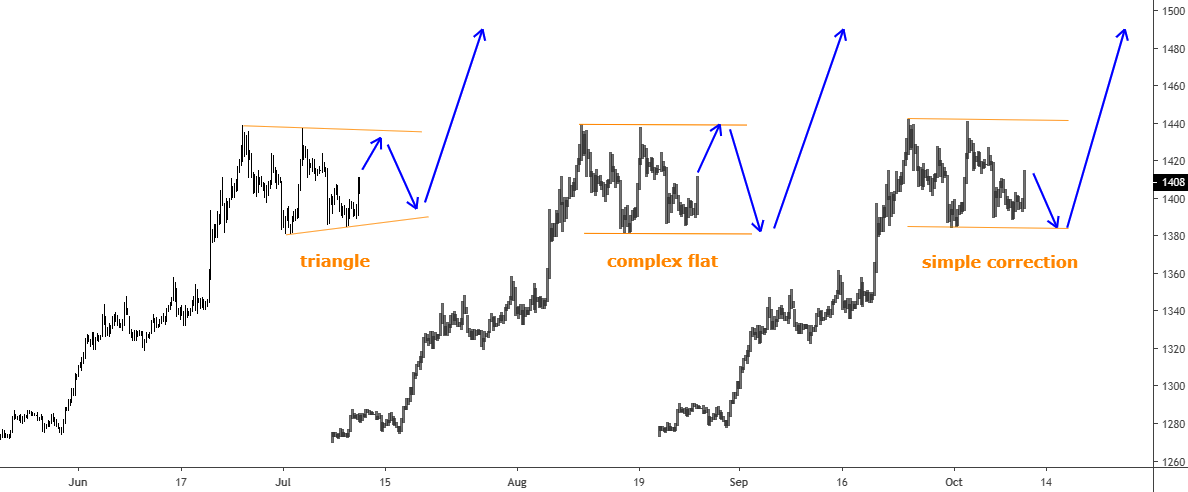
The mighty metal has almost hit the Bull Flag’s target, which was set two months ago. Gold was got close as it reached $1439 on June 25th and only had $6 left to reach that level. Usually, when the impulse of the price gets exhausted without breaking the important level or after it briefly penetrates the latter, then the price quickly retraces in the opposite direction. And that’s what we got with the gold price as the impulse initially looked strong enough to catapult the metal to the $1500 area, but suddenly it failed. Therefore, the price dropped back below $1400 to $1382. Then the buyers actively bought this drop up again to the former top, but they stopped just $1 below it and capitulated there as the price plummeted to $1386 back below $1400. These seesaw moves make traders nervous as it is dangerously volatile with more than $50 setbacks.

The question is if it is a pitfall and we shouldn’t expect any further strength of gold, or it’s just a pit stop to make a pause to accumulate a momentum for another push higher? Let’s look into the chart below to try to figure it out.

I dipped into the 4-hour time frame to show you what happens there.

Gold
Chart courtesy of tradingview.com

First of all, I would like to point out that I believe that we are just in a correction before another push higher, so I choose the pit stop option for the gold. Therefore, my chart will be based on this idea. Continue reading "Gold Update: Pitfall Or Pit Stop?"

Pendulum Swing #8: Gasoline Vs. Natural Gas

We have passed the middle of the year, so it’s time to announce the result of the 7th Pendulum swing pushed this January. The multiple winner Palladium and the earlier loser Lumber were put on the starting point at the beginning of this year.

Let’s see below which one you favored.

Gasoline Natural Gas

Most of you had bet that the metal would beat the forest product. And it appeared to be the right choice! This option was against the Pendulum effect as the lumber was thought to be the winner. I understand the majority’s decision as palladium was on the news as it hit the all-time high levels to become more precious than the gold amid insatiable demand.

The lumber futures chart implied the upcoming weakness after a retest of the broken support. The price has accurately followed that forecast making a pullback to the broken trendline support and then continued down.

Please look at the chart below, all in all, the invincible metal has scored 29% and hit the top of the chart again in the second place. The lumber futures are also in green as it gained 13%, but it was not enough to beat the palladium. The latter kept resistant to the Pendulum effect this time. Continue reading "Pendulum Swing #8: Gasoline Vs. Natural Gas"

Gold Bugs, How Deep Is Your Love?

The title of my previous update was “Calm Before Storm”, and it was not “clickbait” as I spotted a telling market structure that appeared on the chart as a huge visible consolidation had emerged.

Indeed, a sharp move higher followed that post after the consolidation mentioned above had broken out. That move was strong enough to overcome the barrier of the potential triangle’s resistance above $1360. This has invalidated the second option (green arrows) of intermediate triangular consolidation on our master chart. As time goes by, the dust settles, and the chart structure gets clearer eliminating one option after another until only one single way to go remains.

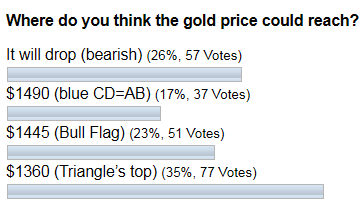
The gold advanced as high as $1437 so far, let’s see how you felt the market one month ago.

gold

Most of you thought that the triangle’s top could stop the market at the $1360 level, but at the same time, you were optimistic about the gold move although a bit conservative. It is interesting that in second place, the votes were given to an opposite bearish scenario. This confirms the idea that market forces are struggling during consolidation, as trading opinions are polar. There is a Bull Flag’s target on the third place, and it is the closest result so far, my congratulations to those who hit that option.

I cleaned the master chart below for you to focus only on one option, and I extended the view there. Continue reading "Gold Bugs, How Deep Is Your Love?"

Don't Get Trapped By Recent Dollar Weakness

Last week I promised to the reader who commented on the dollar index’s strength under my silver post, that I would write a separate piece about the king currency.

Here we are, and I will start from the very long term chart, and you will see why I answered in my comment that it all depends on which time frame we are looking at as these days as the dollar index is falling. Should we worry about it?

Chart 1. Dollar Index Futures Quarterly: Correction

Dollar
Chart courtesy of STOOQ.com

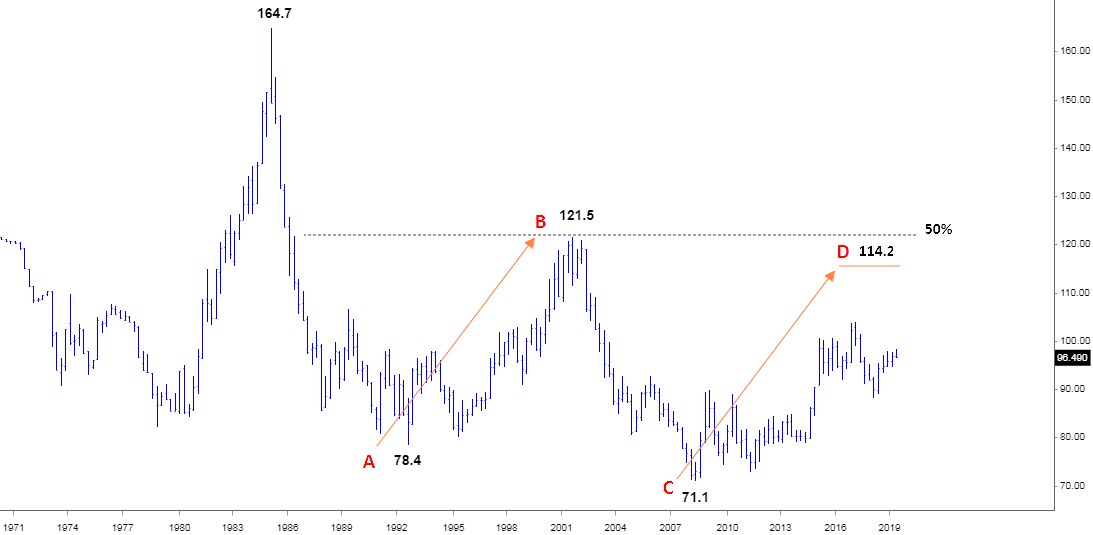
This is a long-term view of the dollar as almost 50 years passed since 1971. For the whole period, the maximum price was established in 1985 when the dollar index hit 164.7. After that, it dropped like a rock down to the 78.4 in 1992. And then we can see a huge correction that had reached exactly a 50% Fibonacci retracement level at 121.5 in 2001. That strength of the dollar turned out to be short-lived as another drop followed. This time it had fallen much faster as it quickly reached the former trough and after a small consolidation, the index slid further down to a new four-decade low of 71.1 in 2008 amid the financial crisis. Continue reading "Don't Get Trapped By Recent Dollar Weakness"