Copper Update: Compressed Spring Could Snap Back Hard

I’ve had a bearish outlook for copper for the past 2 years, starting with my post back in September 2017 when I had doubted the metal’s ability to sustain a long-term rally. Last July, we got the final confirmation of the trend reversal to the downside. And this past February I shared with you a promising trading opportunity, which had appeared in the copper market as the short-term upward correction invited the bears to sell the copper again around $3.

Indeed, copper has plummeted since then reaching the $2.48 low at the start of this month, but the following rapid bounce into the $2.70 area signaled a possible reversal ahead.

Let’s check the charts below to see if we can find some clues behind this worrisome price action.

I start with the weekly chart as I spotted a bullish pattern there already.
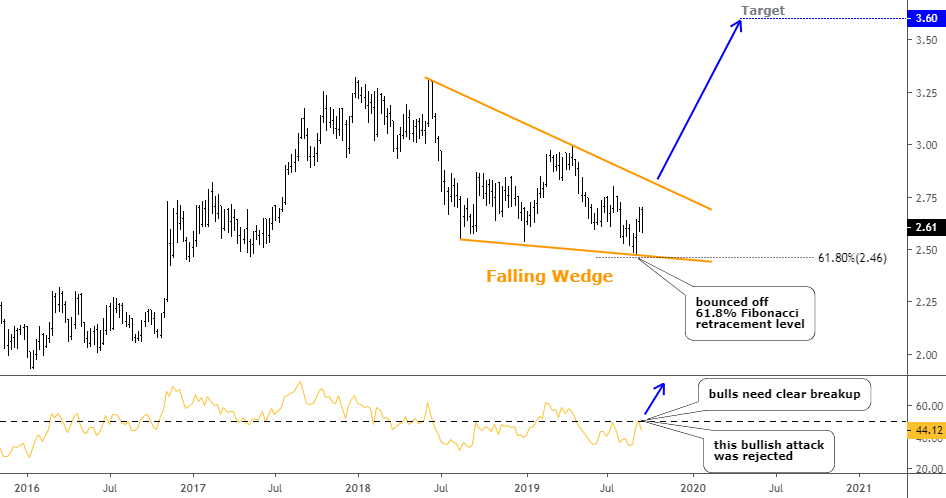
Weekly Cooper Chart
Chart courtesy of tradingview.com

As I said above the price printed the low of $2.48 and quickly reversed then. I added the Fibonacci retracement level of 61.8% to the chart, and you can see now that the price bounced right off it. In my February post, I applied AB/CD segments to set the target area for an anticipated drop and even used the extension ratio, where the CD is even larger than the AB segment. Continue reading "Copper Update: Compressed Spring Could Snap Back Hard"

Gold Update: Is A Bear Face Showing Up?

Gold has missed our main target by $20 as it topped at the $1557 on the 4th of September. The gold optimists still benefited nicely as this peak was $67 above the first target of $1490, that we hit more than one month ago. So, it was definitely worth it to keep bullish for one more month.

Let’s see below if there were a lot of gold optimists a month ago.

Gold Poll

Indeed, the majority with a large margin preferred the continuation of the gold’s rally. It means you could book more than $60 for every ounce staying bullish. Thank you for support as I also believed in that outcome.

In the meantime, we should bear in mind that this was just a considerable correction, which had started in December of 2015. It has been retracing the other drop between 2011 and 2015. So, it is evident that the considerable drop and the correction are almost equal in time it took to emerge – 4 years both. Shall we book the recent rally as “done”? Continue reading "Gold Update: Is A Bear Face Showing Up?"

Bitcoin Is Running Out Of Time

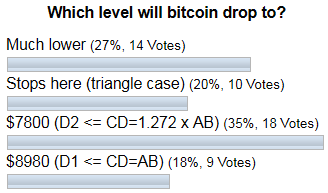
Last month I updated the Bitcoin chart after this cryptocurrency made a buzz at the end of the June pushing through $13,000. In the same post, I shared with you the 4-hour chart where the horizontal consolidation had been spotted. The Bitcoin price was at the $11,500 level then, and I expected it to drop lower to complete the correction.

Let’s see below what you were waiting for Bitcoin then.

Bitcoin Poll

The majority of you expected Bitcoin to drop to the $7,800. Bitcoin haters were second to see head much lower. And the fans were in the third place with an immediate reversal option (stops here).

So far the least liked option of CD=AB at the $8,980 was the most accurate prediction as the Bitcoin indeed dropped lower but only to the $9,071. I think that time emotions were above the calm mind as the 5-digit price tag of the crypto spurred both euphoria and hatred as opinions were divided. Continue reading "Bitcoin Is Running Out Of Time"

Silver Smashed The Target Early; Now I See 3 Options

On the 24th of July, silver had reached the target of $16.6, which I had set in June when the price was at $14.55. It finished that move way ahead of time as the time target; Now on the 2nd of September. It took the poor man’s gold only 41 bars to arrive at the destination instead of amazingly equal periods of 69 bars in AB and BC segments.

Quite often silver makes a surprise for the market as it was submissive before and now it lives in the clouds like an eagle outshining the gold.

Let’s see how you had predicted the future of silver in the poll below.

Silver

No questions, it was one of the clearest ballots on the blog. The majority with absolute dominance had chosen the success of the bullish move and were right, again! Last time one of the readers expressed his fears about those facts that the majority in the ballots predicts very well so far. Here is more fantastic proof! Maybe this is what we call the power of the Hive Mind (Collective Intelligence).

What’s next? Continue reading "Silver Smashed The Target Early; Now I See 3 Options"

Gold Hit First Target

Last Wednesday gold had hit the minimum target of $1490 that we were waiting for since January when the price was at $1288. The target was clear, but the path was not and only this May the market eliminated one of three possible options. One month later, it has finally shown its real face leaving the single initial path to go.

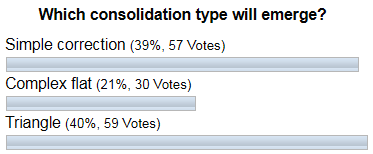
Last month gold advanced quite well, but it failed ahead of the first target. I spotted the consolidation on the 4-hour chart and shared it with you to reassure disappointed bullish traders as to when the price doesn’t reach the target someone could start to exit early. Consolidations are tricky by nature, and I showed you three possible types it could unfold. Let’s see below which one you liked the most.

Gold Poll

The triangular type was your first choice; the simple correction was the second with a minor gap, and the complex flat was the least liked. And again the majority of you were right as this was a triangle. Let’s see it in the updated 4-hourly chart below. Continue reading "Gold Hit First Target"