S&P 500, Dollar Index, Gold, And Silver Updates

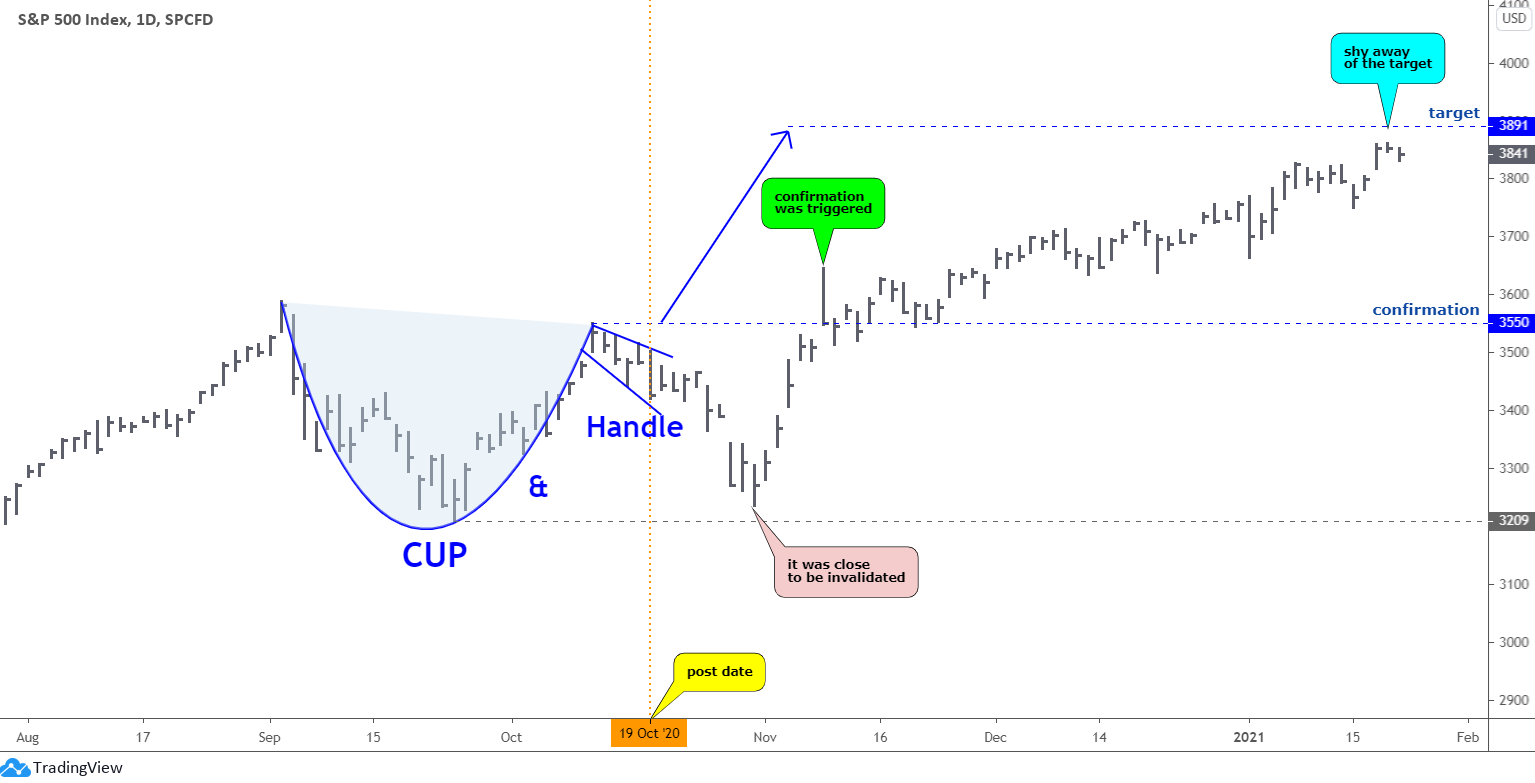
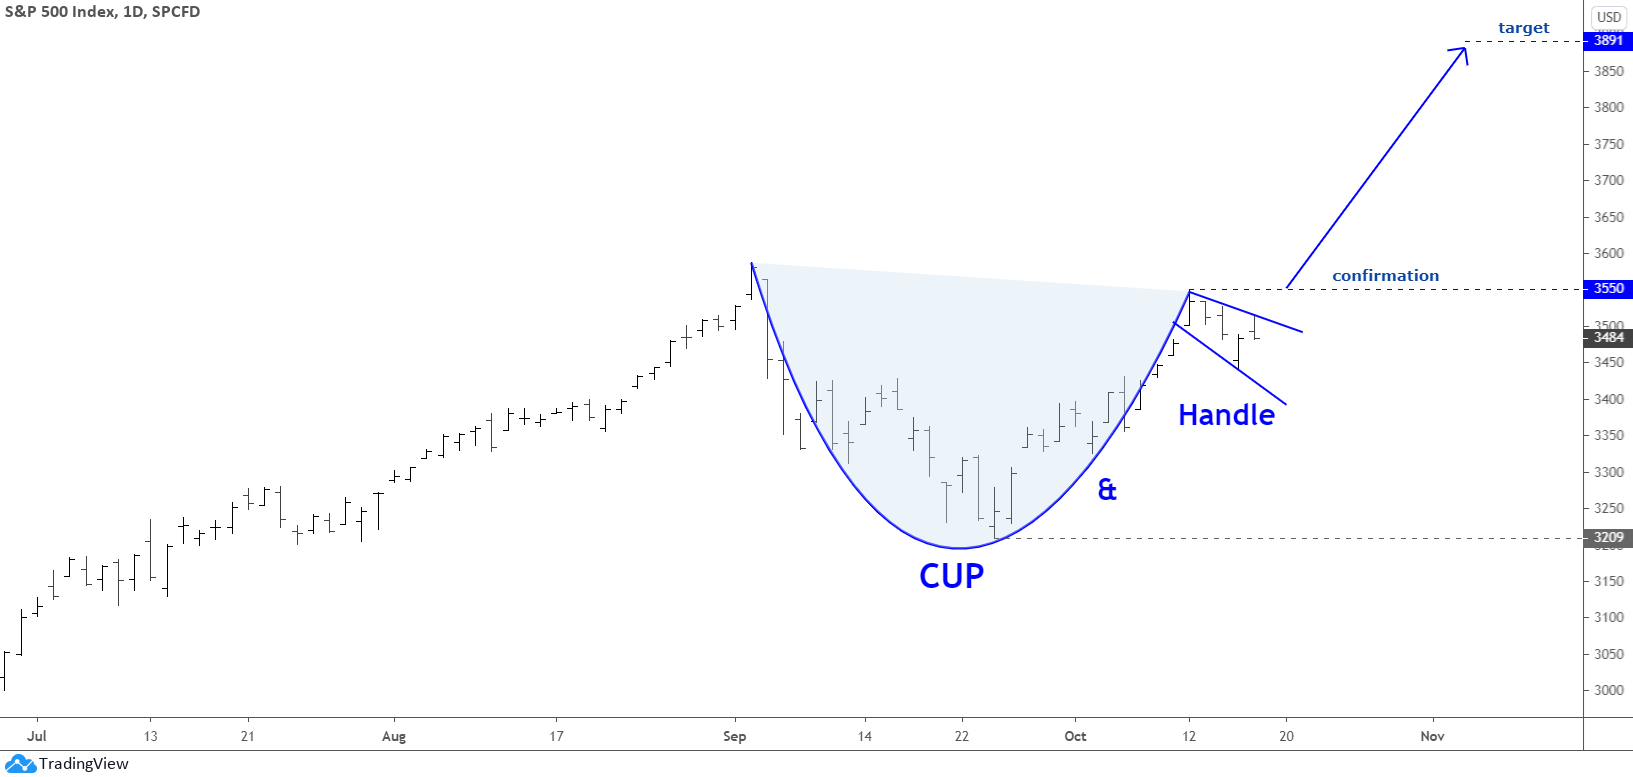
Before I start this update about the dollar, gold and silver, I would like to show you how accurate your prediction was for the S&P 500 back in October of 2020! At the time, I demonstrated to you the well-known Cup & Handle pattern in the making. That model was promising as the target was set at an ambitious $3891 level. Let us see it again below to refresh the memory.

S&P 500, Dollar Index, Gold, And Silver Updates

When I asked your opinion, whether this pattern is valid and will play out, most of you replied positively and supported my target. Let us see in the updated chart below how it played out.

S&P 500, Dollar Index, Gold, And Silver Updates

Your "crystal ball" worked perfectly as the new record maximum established last Thursday at $3860 had been just $31 below the target. The price action was not straight to the target as after the post, the price dropped quite deep, and the whole model was close to invalidation. Luckily, the further reversal built the "no look back" upside move. Continue reading "S&P 500, Dollar Index, Gold, And Silver Updates"

Gold & Silver: The Dollar Still Looks North

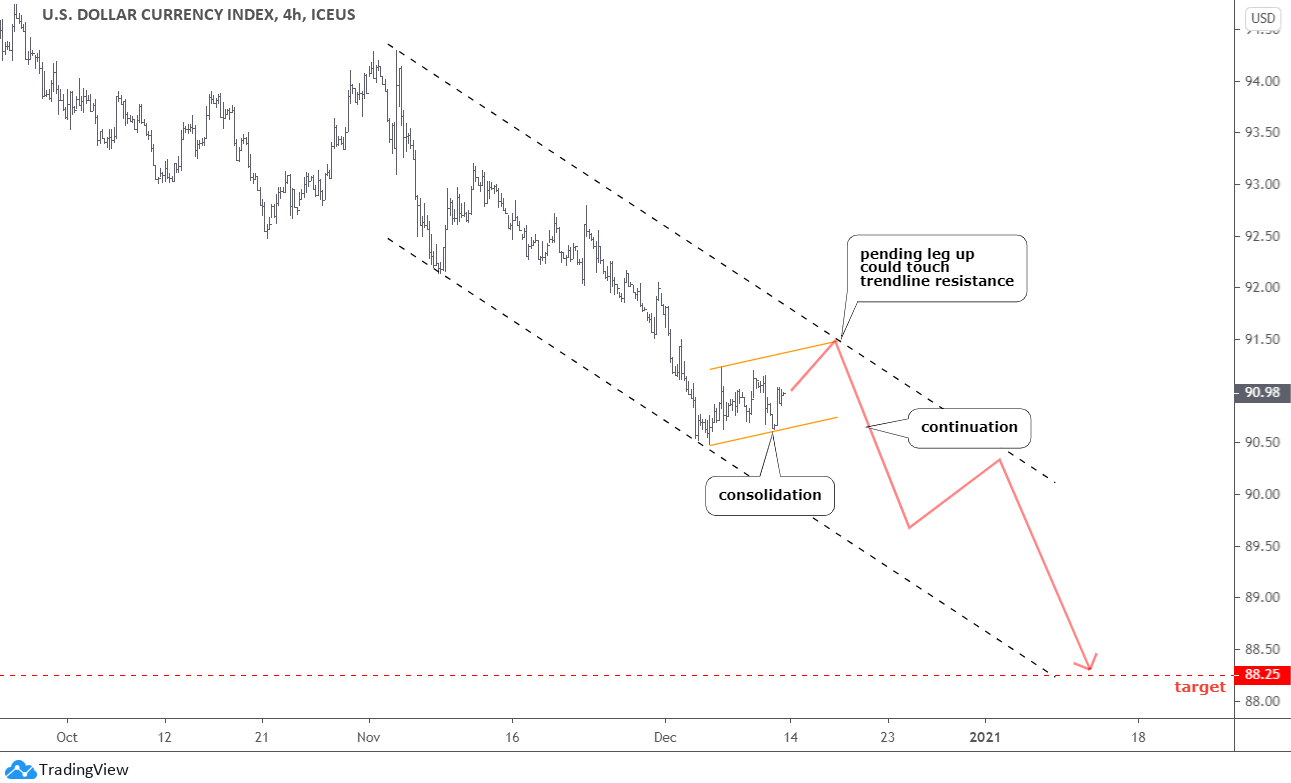
The bouncing U.S. dollar index (DXY) makes the game these days for the top metals, so I added its chart below to show you the possible path of the next move.

U.S. Dollar Chart

Most of you agreed with the map that I showed you a month ago. It indicated more downside for the DXY. On the 6th of January, the dollar established a new valley at 89.21, proving we were right. The price followed the red zigzag down and even the turning point set around 89.5. Continue reading "Gold & Silver: The Dollar Still Looks North"

A Poisoned Silver Arrow

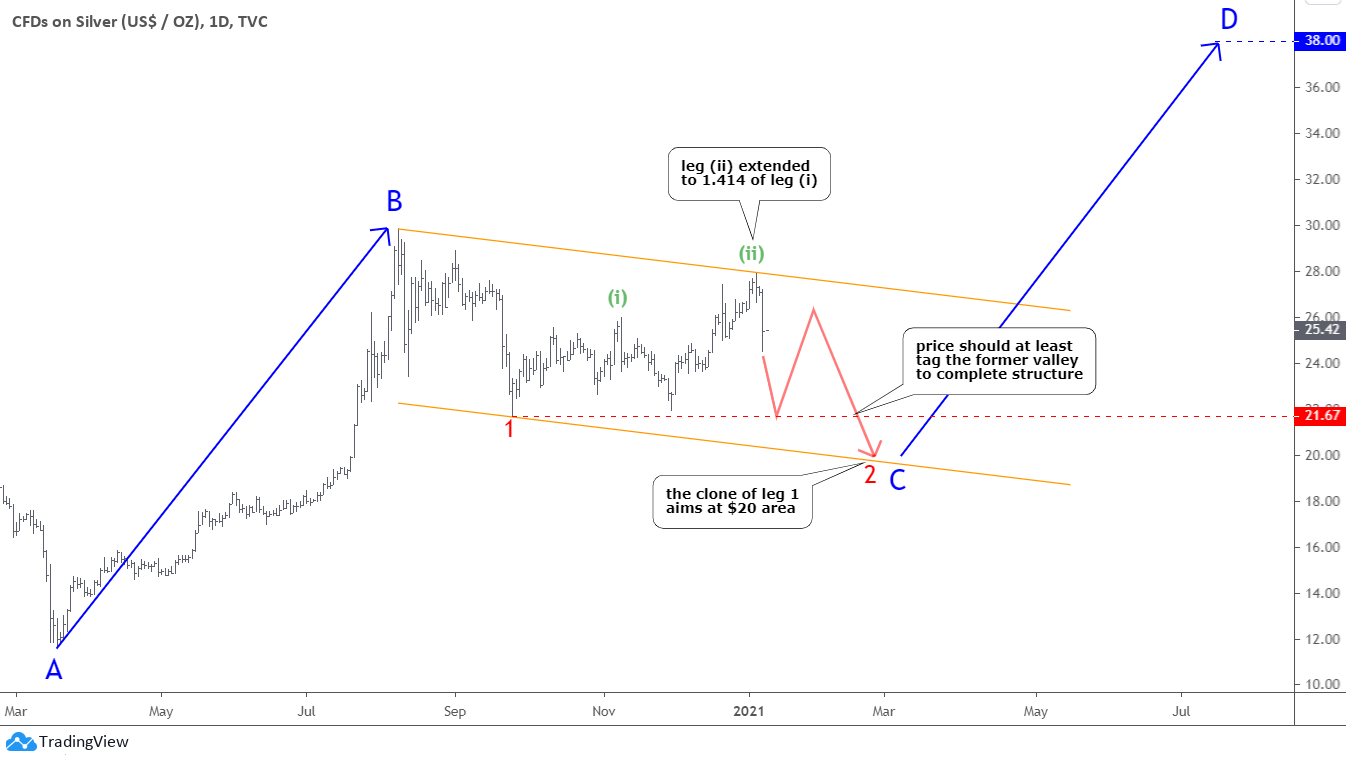
There is a quote from my post in November of 2020 - "Silver could spoil this party where the stars aligned for DXY and gold." I've meant that the uncompleted chart structure in the silver graph could signal a more complex correction despite the bullish move as it was just the junction between larger downside moves. These words turned prophetic as a poisoned silver arrow hit precious metals badly last week.

Hold on tight; the roller-coaster ride carries on.

Let us start with the silver chart below, and you will see why I chose it to be the first.

Silver Daily Chart

You saw this chart a month ago when I was questioning "Could Santa Only Visit Gold?" as I doubted the non-stop rocket move for silver.

It is the exact same chart with an updated price graph. The green leg (ii) of the joint moved exactly as projected in December. It just traveled a longer distance equal to 1.414 of the green leg (i). That is why I turned the orange trend channel higher. Continue reading "A Poisoned Silver Arrow"

Top Currencies VS. Gold In 2020: This "Rookie" Rocks!

The time has come to see if any top currency could rival gold, which established the new all-time-high this year in this traditional yearly post.

Seven currencies represent the fiat money: U.S. dollar (USD) and six components of the U.S. dollar index (DXY) placed by weight: Euro (EUR), Japanese yen (JPY), British pound (GBP), Canadian dollar (CAD), Swedish krona (SEK) and the Swiss franc (CHF). Bitcoin (BITSTAMPUSD) is also here to represent the hyped crypto-world.

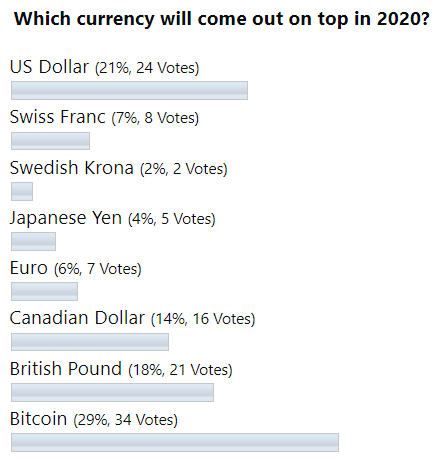
Before we jump to the results of 2020, let us see below how you predicted the future back at the end of December 2019.

LLLL

The majority of you bet that the "rookie" Bitcoin would beat all others, including the regular favorite U.S. dollar in 2020. The latter was the second choice a year ago. The third pick was interesting as it was the British pound, which was not in the shortlist of your bets before, but it managed to rank #3 last year.

Let us look at the diagram below to find out the results. Continue reading "Top Currencies VS. Gold In 2020: This "Rookie" Rocks!"

Buy Setup For Gold, Two Paths For Silver

The plan posted at the end of November works amazingly well, so far as price accurately charts the preset pattern at least for the gold, which could offer a good trading opportunity soon.

Let us check the "King's" chart first to see what's happening.

Dollar Index

I switched to a smaller time frame to focus on the current leg down, as we saw on the chart before.

The U.S. dollar index (DXY) is building a slightly up-sloping sideways consolidation (orange channel). I think we can see another leg up to touch both the upside of the orange channel and the trendline resistance of the black dashed downtrend. This area around 91.5 would offer double resistance. Continue reading "Buy Setup For Gold, Two Paths For Silver"