US Treasury Touches "Crypto-waters"

On 6th of April, the U.S. Department of the Treasury published the 2023 DeFi Illicit Finance Risk Assessment, the first illicit finance risk assessment conducted on decentralized finance (DeFi) in the world. The assessment considers risks associated with what are commonly called DeFi services.

The document is 42 pages long. This report looks at how criminals are using DeFi services to move and hide money illegally. DeFi services use technology called blockchain and smart contracts to allow people to make transactions without banks or other financial institutions.

However, many DeFi services are not following the rules meant to stop money laundering and financing terrorism. Some DeFi services are trying to avoid these rules by claiming to be fully decentralized, but this doesn't excuse them from following the rules.

The report recommends improving the rules and regulations for DeFi services to make sure they follow the laws and don't help criminals.

The cryptocurrency market may face regulatory scrutiny as authorities look to increase oversight on digital assets, so be informed and prepared for real bombshells in the not so distant future.

What do you think is the real target of the Treasury?

View Results

Loading ... Loading ...

I would love to see your comments on this news.

Let me update some crypto charts to snapshot what’s going there. The comparison chart of major cryptos vs. the market follows below. Continue reading "US Treasury Touches "Crypto-waters""

Gold And Tesla: Bulls Check Barriers

Last month, I presented three potential scenarios for the future price of gold in an earlier Gold Update.

In the poll, most of you chose the green path, which suggested an extended period of consolidation for the yellow metal. However, it appears that the blue (straight bullish) and black (similar to the pattern observed in 2017) paths are more accurate, as the green path is no longer viable.

Gold Futures Daily

Source: TradingView

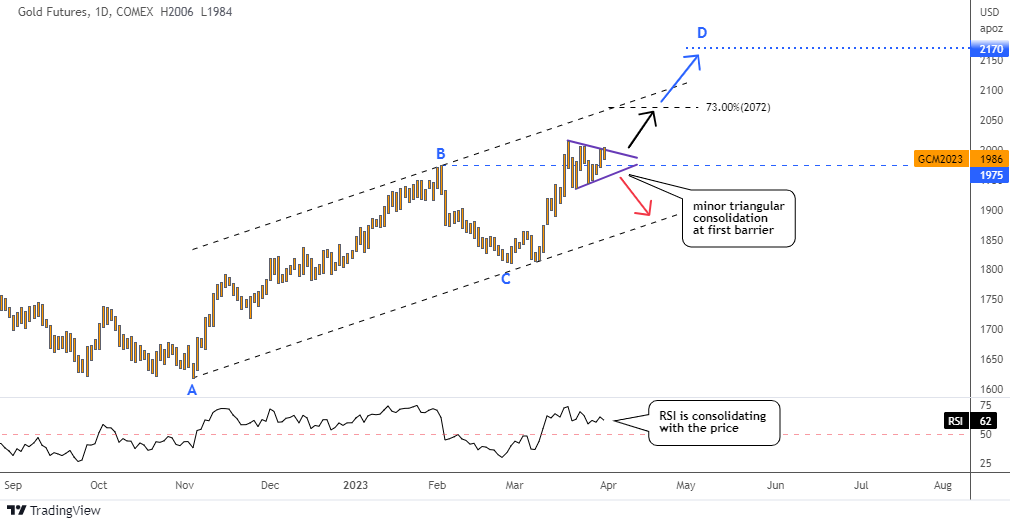
In just two weeks since the last update, the price of gold futures has increased by $160 or nearly 9%, reaching a high of $2,015 on March 20th. This surge in price caused the previous top at the blue B point of $1,975 to be broken, but the price has since been consolidating around this level.

The price of gold futures has formed a triangle pattern (purple) characterized by falling peaks amid rising valleys. The size of the pattern is relatively small, and last week, the price attempted to break out of the pattern to the upside but was unsuccessful.

As a result, the upside potential of the move may be limited due to the small amplitude of the pattern. Continue reading "Gold And Tesla: Bulls Check Barriers"

Platinum Cleared The "Launch Pad" For Palladium

In a previous post titled "Platinum Outshines Palladium, Yet Both Offer Opportunity," I discussed potential opportunities for investors to buy into these two white metals.

The fact that platinum was chosen over palladium by three out of five readers in the ballot was not surprising. The platinum/palladium ratio and the chart setup for platinum futures were both supportive of the title's argument.

Let’s check on what has changed in one month. We'll start with platinum futures.

Platinum Futures Daily

Source: TradingView

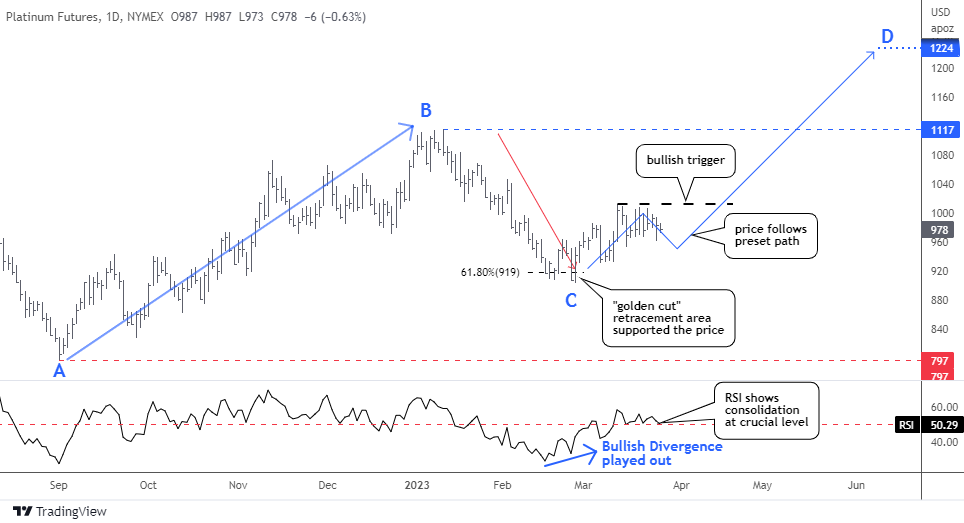
The price of platinum futures has been following my predetermined path with remarkable accuracy. I kept the previous annotations for you to see it.

The forecast that the price would reverse around the "golden cut" 61.8% Fibonacci retracement area proved to be successful, as the price tested the support twice and held. Subsequently, the futures price mimicked the trajectory of the blue zigzag, moving to the upside. Continue reading "Platinum Cleared The "Launch Pad" For Palladium"

Was The Collapse of SVB a Black Swan?

According to some doomsayers, the stock market is on the brink of a crash, and the collapse of Silicon Valley Bank (SVB) is being considered as a potential "Black Swan" event.

They believe it could trigger a domino effect similar to the Lehman Brothers collapse in 2008. There are already indications of this, as the failure of SVB has had a ripple effect in Europe, with the second largest Swiss bank, Credit Suisse, also being hit.

YTD SPF IXG SIVB JPM BAC CS

Source: TradingView

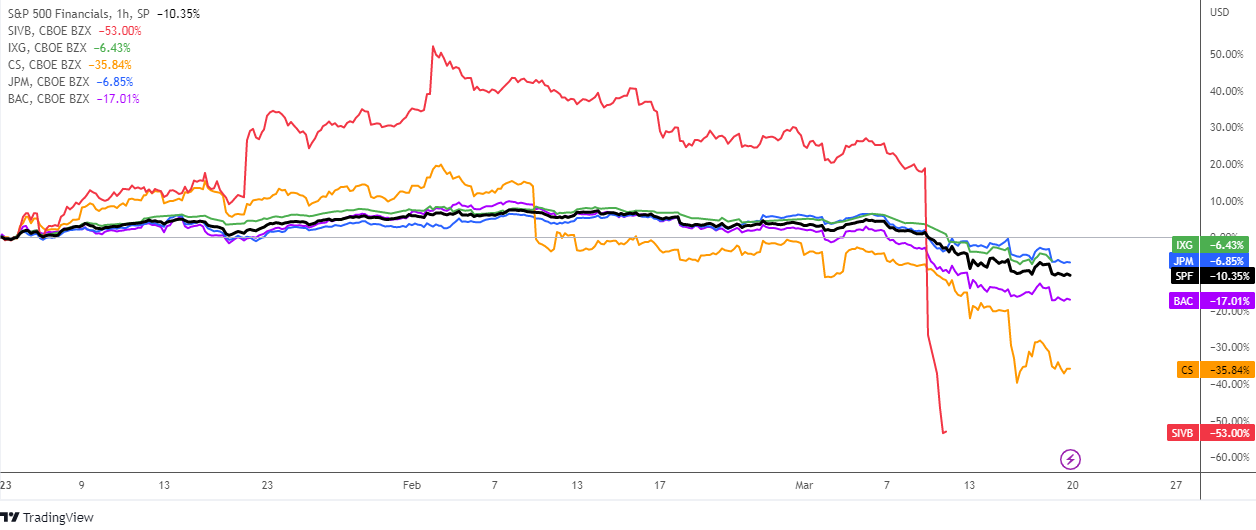
In the comparative chart above there is a year-to-date dynamics of S&P 500 Financials index (SPF, black), the iShares Global Financials ETF (IXG, green), SVB Financial Group (SIVB, red), Credit Suisse (CS, orange), JPMorgan Chase (JPM, blue) and Bank of America (BAC, purple).

On the chart, all of the lines indicate negative performance, with each one below the zero mark. Indeed, SVB and CS are the ultimate losers, while BAC is also suffering a significant loss at -17.01%. Meanwhile, IXG, JPM, and SPF fared slightly better, with losses of -6.43%, -6.85%, and -10.35%, respectively.

This indicates that banking stocks around the world are losing ground following the trigger from SVB, as seen with the decline in IXG and the top two banks in the US. Continue reading "Was The Collapse of SVB a Black Swan?"

"50 Cent" Profits From 3-Letter Acronyms

In February 2023, the US economy produced 311,000 jobs, surpassing market expectations of 205,000, and revised down from 504,000 in January. This indicates a labor market that remains tight, with an average of 343,000 jobs added per month over the previous six months.

This is another upbeat NFP report following last month's even stronger data. The Fed now has more ammunition to potentially raise rates by 0.5% at their next meeting.

Let's take a look at how the market reacted to this report.

1 Day Futures Performance

Chart Courtesy: finviz.com

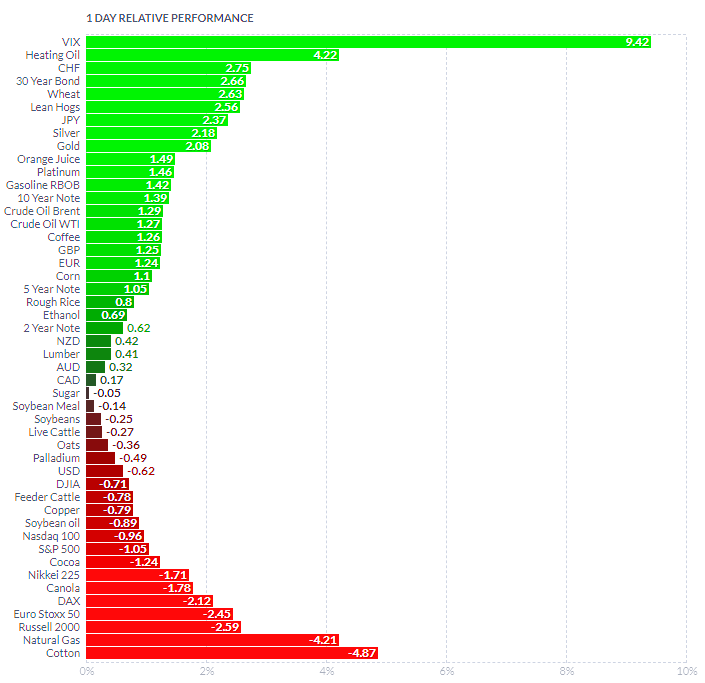
The top three winners last Friday, when the jobs report was published, were VIX, which gained +9.42% in just one day, heating oil futures, which rose by +4.22%, and the Swiss franc, which increased by +2.75%. Continue reading ""50 Cent" Profits From 3-Letter Acronyms"