Bitcoin Nears Trigger, AAPL Set To Rally

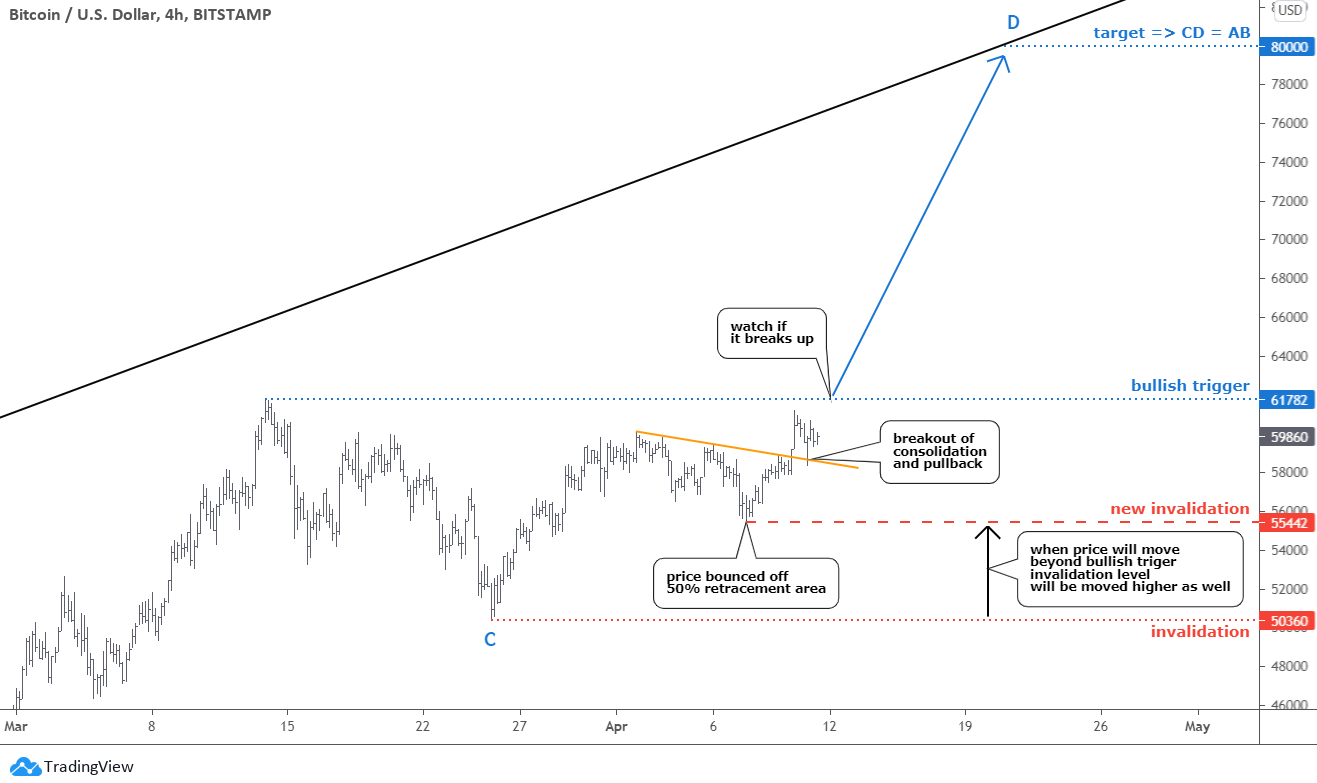
A sleepless Bitcoin moves accurately as per the plan posted last week. The majority of you agreed that the $80k target is achievable for the leading coin. Here is an updated chart below where I zoomed in to a 4-hour time frame to share more details with you.

Bitcoin Price Chart

As I said before, Bitcoin's chart structure builds similarly with conventional trading instruments these days. The forecasted correction reached the 50% Fibonacci retracement level in the $55k area. It stopped there as the price bounced up and hit the orange trendline resistance soon. Continue reading "Bitcoin Nears Trigger, AAPL Set To Rally"

Bitcoin, Dollar, Gold And Silver Update

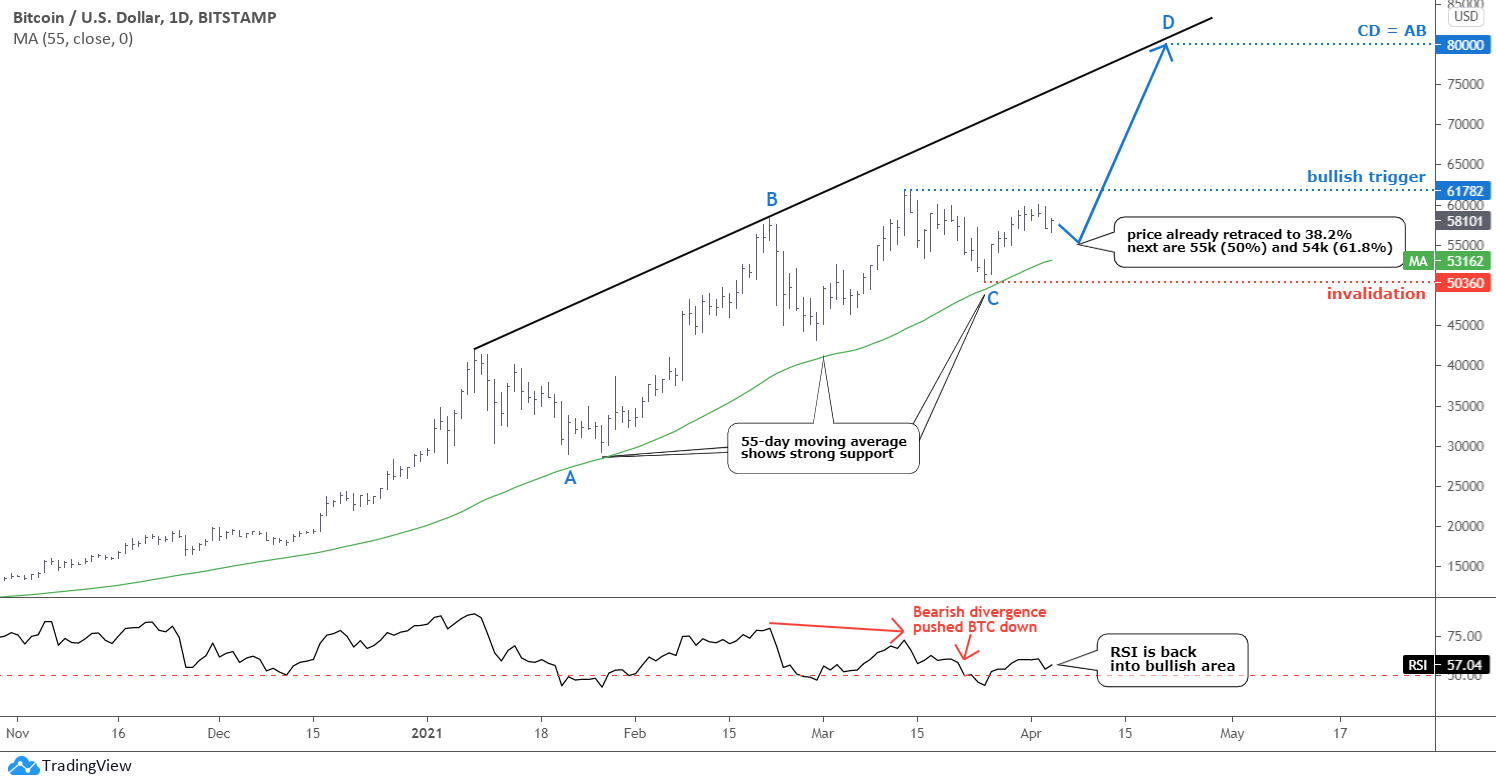
As Bitcoin matures, the chart structure becomes more readable over time. We can see how such a conventional indicator as a moving average perfectly supports the price. I added a 55-day (Fibonacci number) moving average (green), which at least three times this year kept the price in the bullish mode that started last October when the price crossed this line to the upside.

Another popular indicator RSI has perfectly detected the Bearish Divergence and pushed the price down last month. After that, it moved back above the crucial 50 level, which supported the current upward move.

Daily Bitcoin Chart

I see possible AB/CD segments in the chart (blue labels). The BC consolidation was huge and complicated, but it could be over now. If the CD segment travels the same distance as the AB part, then the price of Bitcoin could hit the new all-time high of $80,000. The projection of the black trendline resistance confirms that ambitious target, and we know how powerful the trends are. Continue reading "Bitcoin, Dollar, Gold And Silver Update"

Gold & Silver: Dollar Is Going Down

U.S. dollar index (DXY) 4-hour chart

Dollar Index

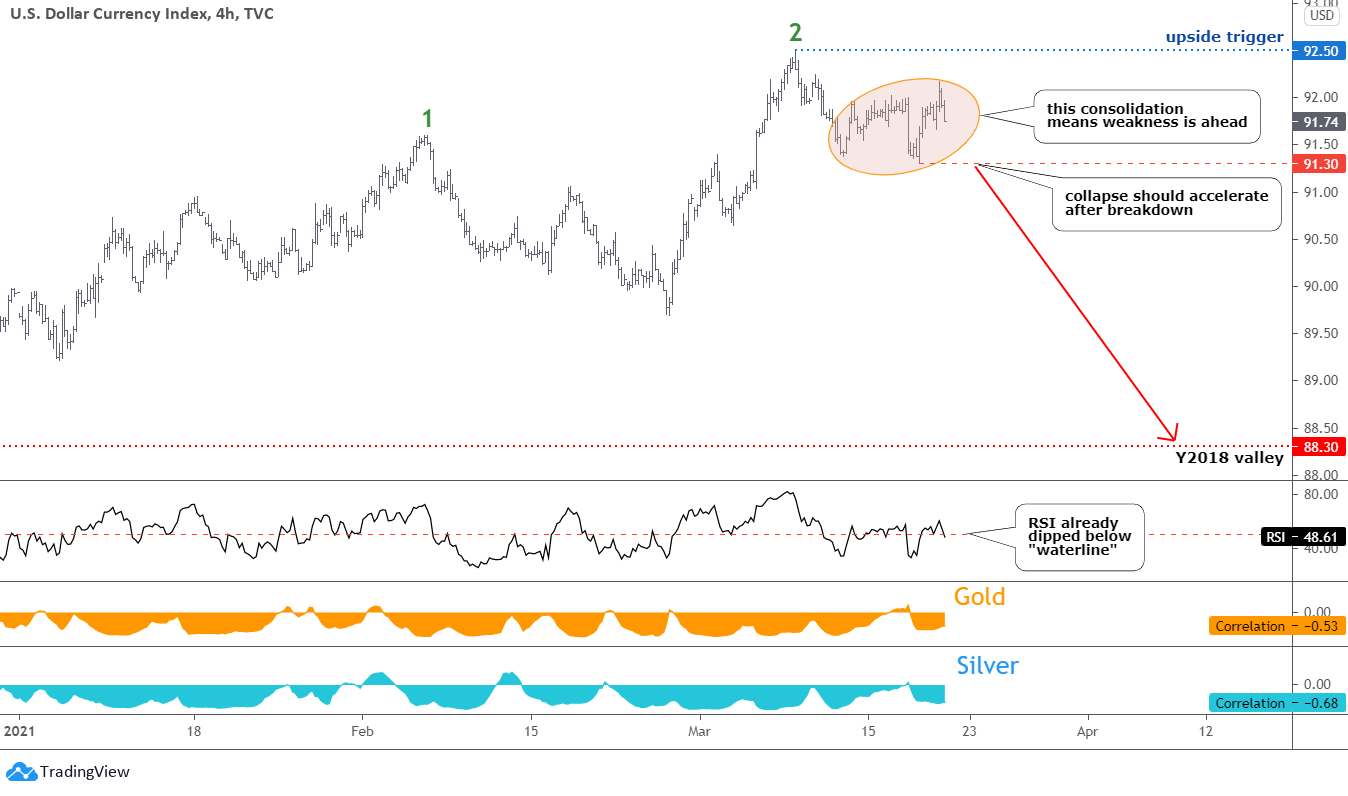
Last time the chart structure of the dollar was less clear; hence I put two opposite scenarios in the chart with triggers.

As time goes by, the market reveals itself more clearly. The DXY price built a familiar two-leg consolidation highlighted with the orange ellipse. It follows the preceding move down from the recent peak of green leg 2. It means further weakness is ahead. I put the trigger on the 91.30 mark (bottom of the minor consolidation) for confirmation. The target remains intact in the area of the Y2018 valley. Continue reading "Gold & Silver: Dollar Is Going Down"

Same Plan For Silver, Wake-Up Call For Gold

The U.S. dollar index (DXY) chart opens this update.

US Dollar Index

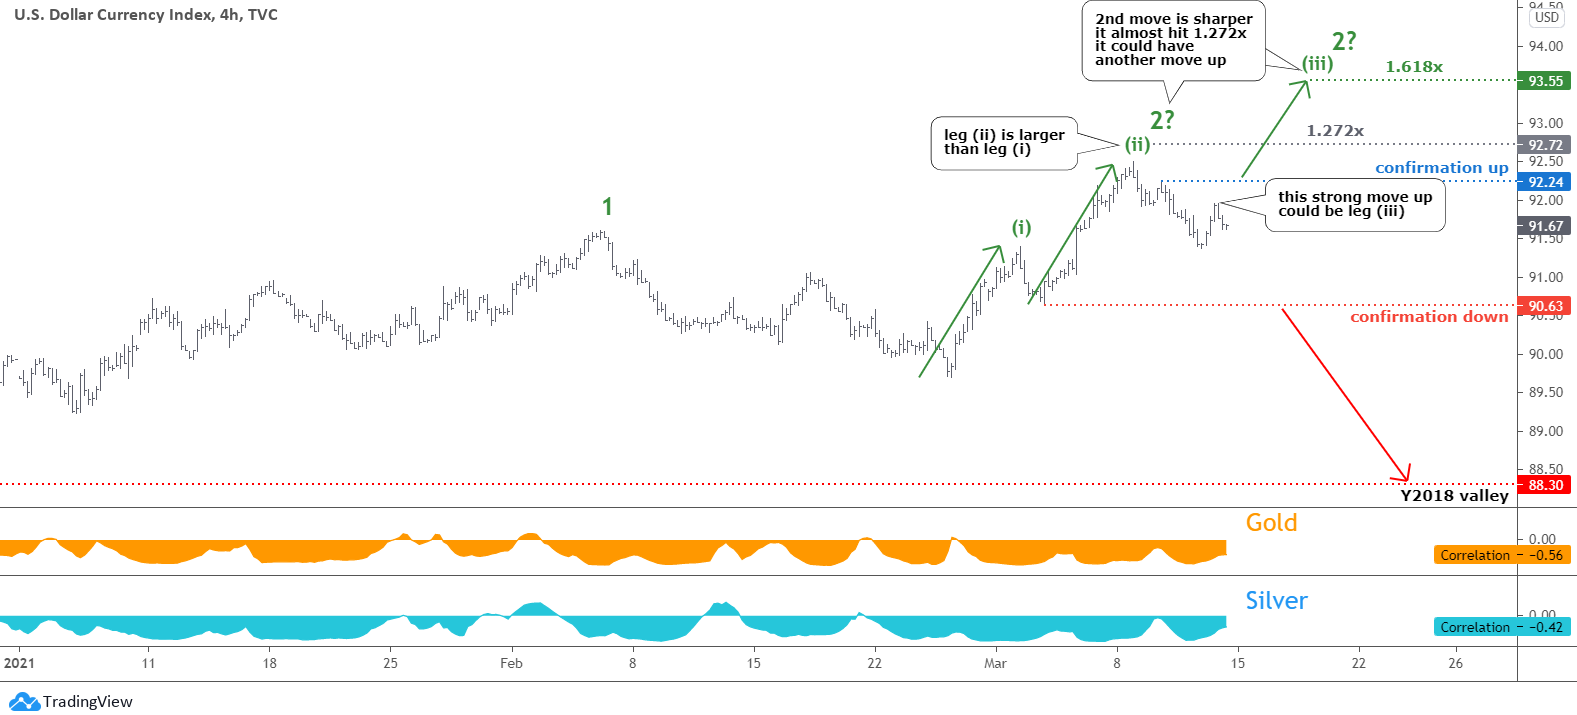
The plan posted at the beginning of this month played out amazingly accurate in the DXY chart. The dollar, indeed, moved to the upside hitting beyond the first target of 92.07, and it almost reached the second goal with a 1.272x multiplier at 92.72 mark. The maximum of 92.50 was established on March 8. This move has a sharper angle, and it reached the target earlier than the clone of the first move up.

This time I put more annotations to highlight all crucial things for education. The main question is whether the second move-up is over or not. We can see two distinct minor legs in the current move to the upside marked as (i) and (ii); the latter is larger than the former. Then the price reversed to the downside within a zigzag. This could be another minor consolidation ahead of the leg (iii) to the upside. Continue reading "Same Plan For Silver, Wake-Up Call For Gold"

Amazon Chart Presents Buying Opportunity

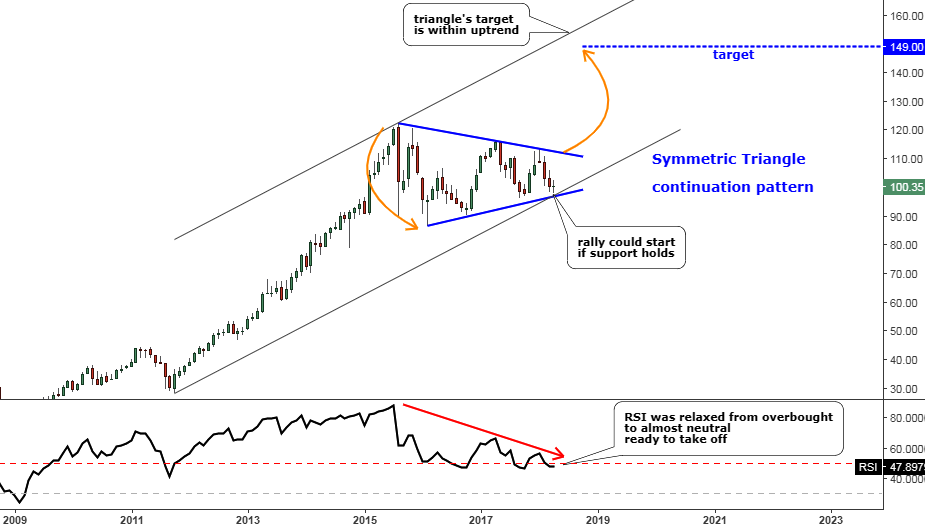
In April 2018, I published the post with the title “Disney Could Rally After A Long Pause”. I spotted an interesting long setup on the Disney (DIS) chart that time. Below is that monthly chart of Disney stock with the bullish setup.

Disney

The combination of higher tops and higher lows has shaped the famous Triangle (Symmetric) pattern highlighted in blue.

The neutral position of the relaxed RSI indicator and the double trendline support on the chart facilitated the bullish opportunity. The target was set at the equal distance of the widest part of the pattern added to the breakout point. It was located at $149 with a potential gain of 50% as the stock was traded around $100.

We can see how it played out in the next chart. Continue reading "Amazon Chart Presents Buying Opportunity"