Gold Has Stalled At Equilibrium

Back in April 2020, in my post, I had surmised "Gold Could Fly Over A Helicopter Throwing Money" as the fourth round of Quantitative Easing (QE4) had started a month earlier in March 2020 with an initial pledge to inject $700 billion via asset purchases to support U.S. liquidity. The price of gold was $1,681 at that time.

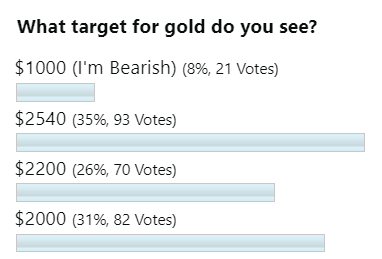
We all knew that the printing press should push gold prices higher. I tried to calculate the possible target area for the gold price using comparative analysis of the past period, and then I set the range of three goals: $2,000-$2,200-$2,540. Your reaction had come as follows.

Gold Poll

The ultra-bullish $2,540 target dominated the ballot. However, the second bet with a more realistic $2,000 target was the closest yet as we saw the all-time high at $2,075 in August 2020. I guess I found the reason for this outcome in the monthly chart below. Continue reading "Gold Has Stalled At Equilibrium"

Top Cryptos vs. Bitcoin In 2021

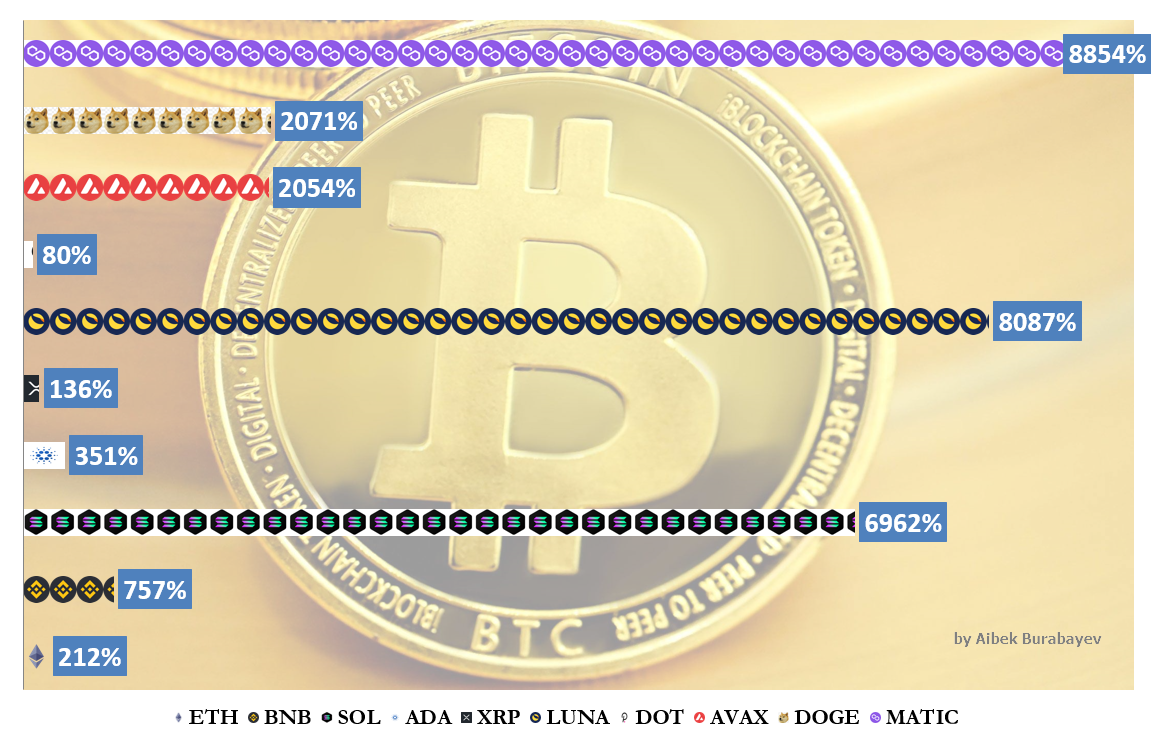
2021 is done, and we can check the performance of top cryptocurrencies compared with the main coin for the past year. I promised to build this leaderboard in my earlier post where I compared fiat currencies with gold.

The crypto universe repeatedly extends as new coins and tokens appear in the arena one by one. I put the top ten largest cryptocurrencies by the market cap against Bitcoin in this post. I skipped stablecoins and Shiba Inu coin as the latter has less than one year of history.

Bitcoin vs. Crypto
Diagram by Aibek Burabayev; data source: Binance

It was a good year for Bitcoin, gaining almost 60% against the U.S. dollar in 2021. However, in its own digital universe, it was the loser to all top cryptocurrencies, as you can see in the comparison above.

Let's check the top three leaders. Continue reading "Top Cryptos vs. Bitcoin In 2021"

Top Fiat Currencies vs. Gold in 2021: "The Last Shall Be First"

It is time for a traditional yearly post to find out which fiat could beat the conventional store of value this year; all failed last year.

Seven currencies represent the fiat money: U.S. dollar (USD) and six components of the U.S. Dollar Index (DXY) placed by weight: Euro (EUR), Japanese Yen (JPY), British Pound (GBP), Canadian Dollar (CAD), Swedish Krona (SEK) and the Swiss Franc (CHF).

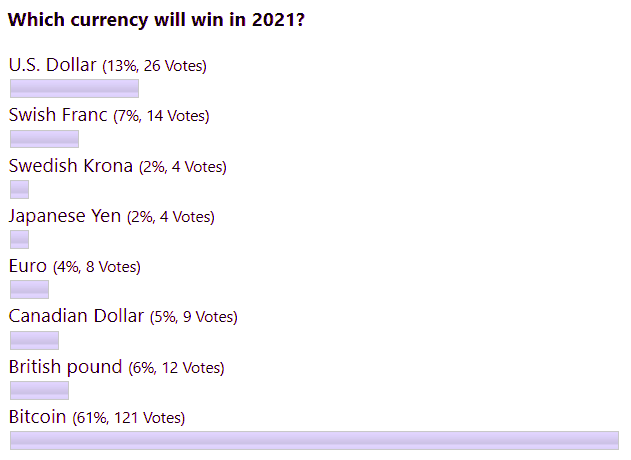
Let us see below how you predicted the future back at the end of December 2020.

Currency

Most of you picked Bitcoin, aka 'digital gold,' to win the race. You were right again; Bitcoin gained more than 80% against the gold this time. I will build a separate leaderboard for cryptos in coming posts as the main coin has its universe with a pack of newbies trying to claim the throne, so stay tuned.

The regular favorite, the U.S. dollar, was the second choice this year. The third bet was not obvious to me as the Swiss franc usually has been lost in the shadows somewhere between regular champions and exotic bets. Continue reading "Top Fiat Currencies vs. Gold in 2021: "The Last Shall Be First""

Is The Dollar Going To Steal The Santa Claus Rally?

Top metals failed to keep on the bullish track set earlier. A heavy-duty dollar reinforced by historically high inflation, earlier tapering expectations, and a turn to safety puts pressure on precious metals.

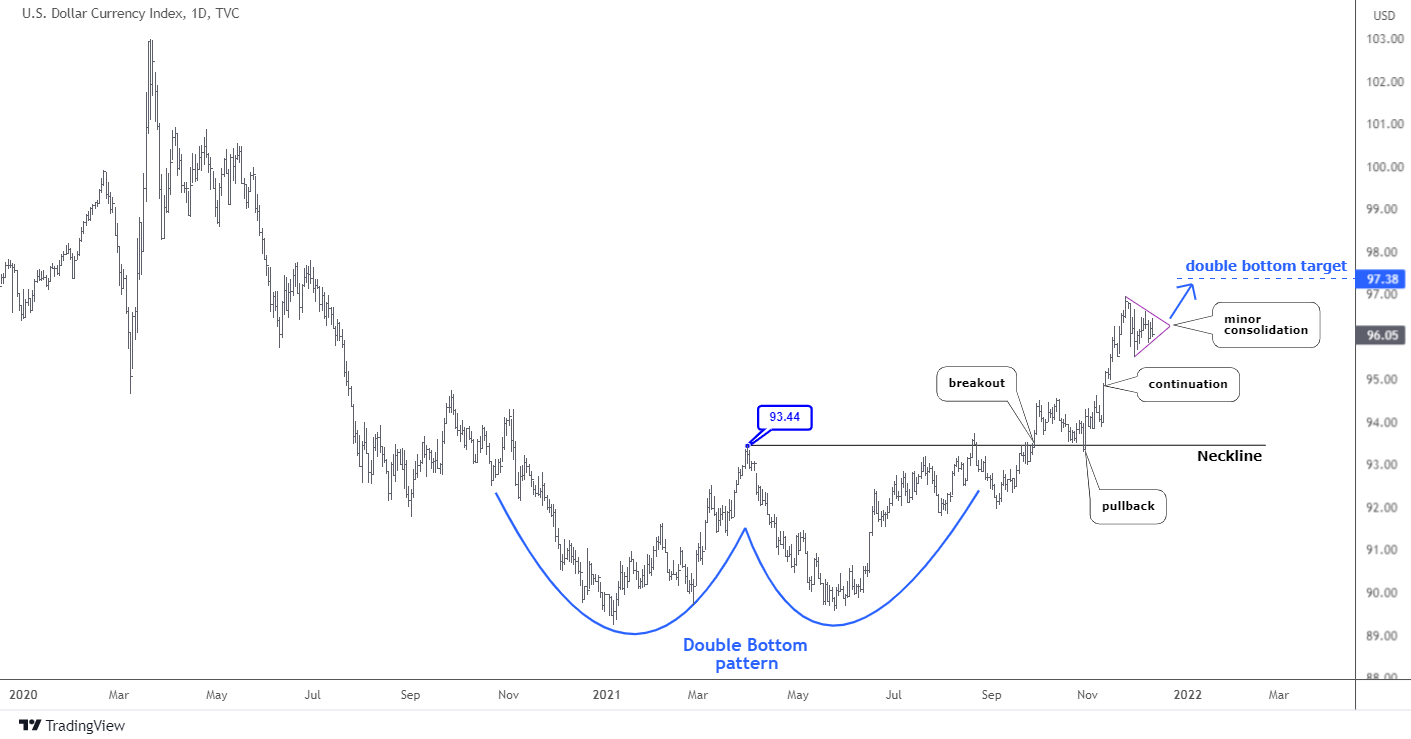
Let us see what is currently happening with the Dollar Index in the daily chart below.

Dollar

The well-known "Double Bottom" (blue) pattern has emerged in the summer. It is a textbook case as all stages went precisely as they should appear.

The focus was on the breakup of the so-called "Neckline" (black horizontal line) located at the top between the two bottoms at $93.44. The first attempt to crack that level occurred at the end of August, but it failed. After a small retracement, the second attempt at the end of September succeeded in breaking out. The impulse was so strong that the price overshot the Neckline with a big margin to hit the fresh one-year top of $94.5. Continue reading "Is The Dollar Going To Steal The Santa Claus Rally?"

Emerging Markets - Risk Off?

I would like to share my recent finding in the Emerging Markets ETF chart, as it could be a wake-up call for investors from the distant 2007.

Usually, emerging markets provide a higher return amid a higher risk profile. When investors cut the risk, they often start with emerging markets to quit until the liquidity is available.

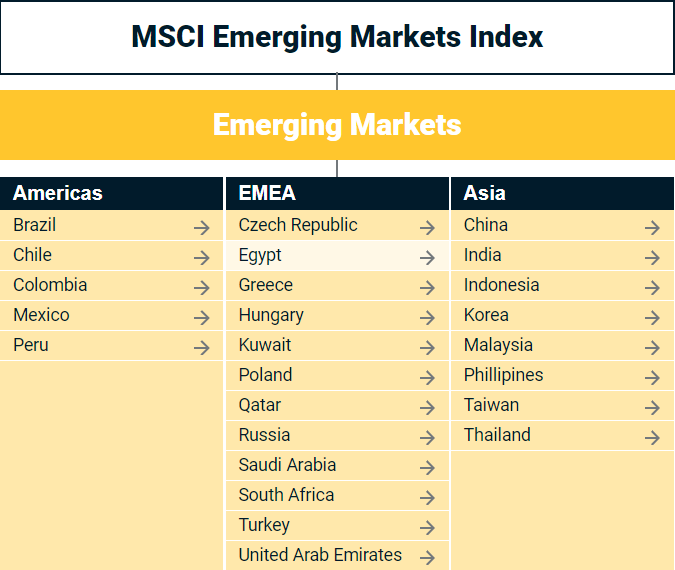
The chart below represents the dynamics of iShares MSCI Emerging Markets ETF (EEM). It tracks the MSCI Emerging Markets Index covering 25 countries shown in the following graph.

LLLL

Source: msci.com

Continue reading "Emerging Markets - Risk Off?"