
Inflation cooled again last month after starting to decline in October.
The Labor Department reported that the Consumer Price Index (CPI) in November rose 7.1% increase year-over-year and was just 0.1% from the previous month.
Economists surveyed by Dow Jones expected prices to grow at an annual 7.3% and 0.3% over the prior month.
The favorable November inflation report kept the Fed on track to increase interest rates by a relatively smaller amount after four consecutive hikes of 75-basis-point magnitude.
In addition to the optimism surrounding the decline in the Fed rate hikes, December has proven to be a strong month for the stock market over the past 70 years. However, many experts still expect a mild recession next year.
Given the backdrop, it could be wise to take advantage of the uptrend in JPMorgan Ultra-Short Income ETF (JPST), IQ MacKay Municipal Intermediate ETF (MMIT), and VanEck Long Muni ETF (MLN) to diversify your portfolio this month.
JPMorgan Ultra-Short Income ETF (JPST)
JPST is an actively managed, ultra-short-term, broad-market bond fund that aims to maximize income and preserve capital.
The fund makes investments in fixed-rate, variable-rate, and floating-rate debt, including corporate issues, asset-backed securities, and debt pertaining to mortgages, as well as U.S. government and agency debt, including treasury securities.
JPST has $22.76 billion in assets under management. The fund has a total of 467 holdings. Its top holdings include U.S. Dollar with a 44.64% weighting, Fixed Income (unclassified) at 1.73%, BNP Paribas S.A. 3.5% at 0.94%, and Nordea Bank AB (New York) FRN at 0.81%.
JPST has an expense ratio of 0.18%, lower than the category average of 0.60%. Over the past six months, JPST's fund inflows came in at $4.14 billion. Also, it has a beta of 0.04, indicating extremely low volatility compared to the broader market.
JPST pays an annual dividend of $1.04, which yields 2.08% on prevailing prices. Its dividend payments have grown at a 16.9% CAGR over the past five years. The fund has a record of dividend payments for five consecutive years.
JPST has gained marginally over the past month to close the last trading session at $50.19. It has a NAV of $50.19 as of December 12, 2022.
MarketClub's Trade Triangles show that JPST has been trending UP for two of the three time horizons. The long-term trend for JPST has been UP since November 22, 2022, while its intermediate-term trend has been UP since November 15, 2022. The short-term trend has been DOWN since December 15, 2022.
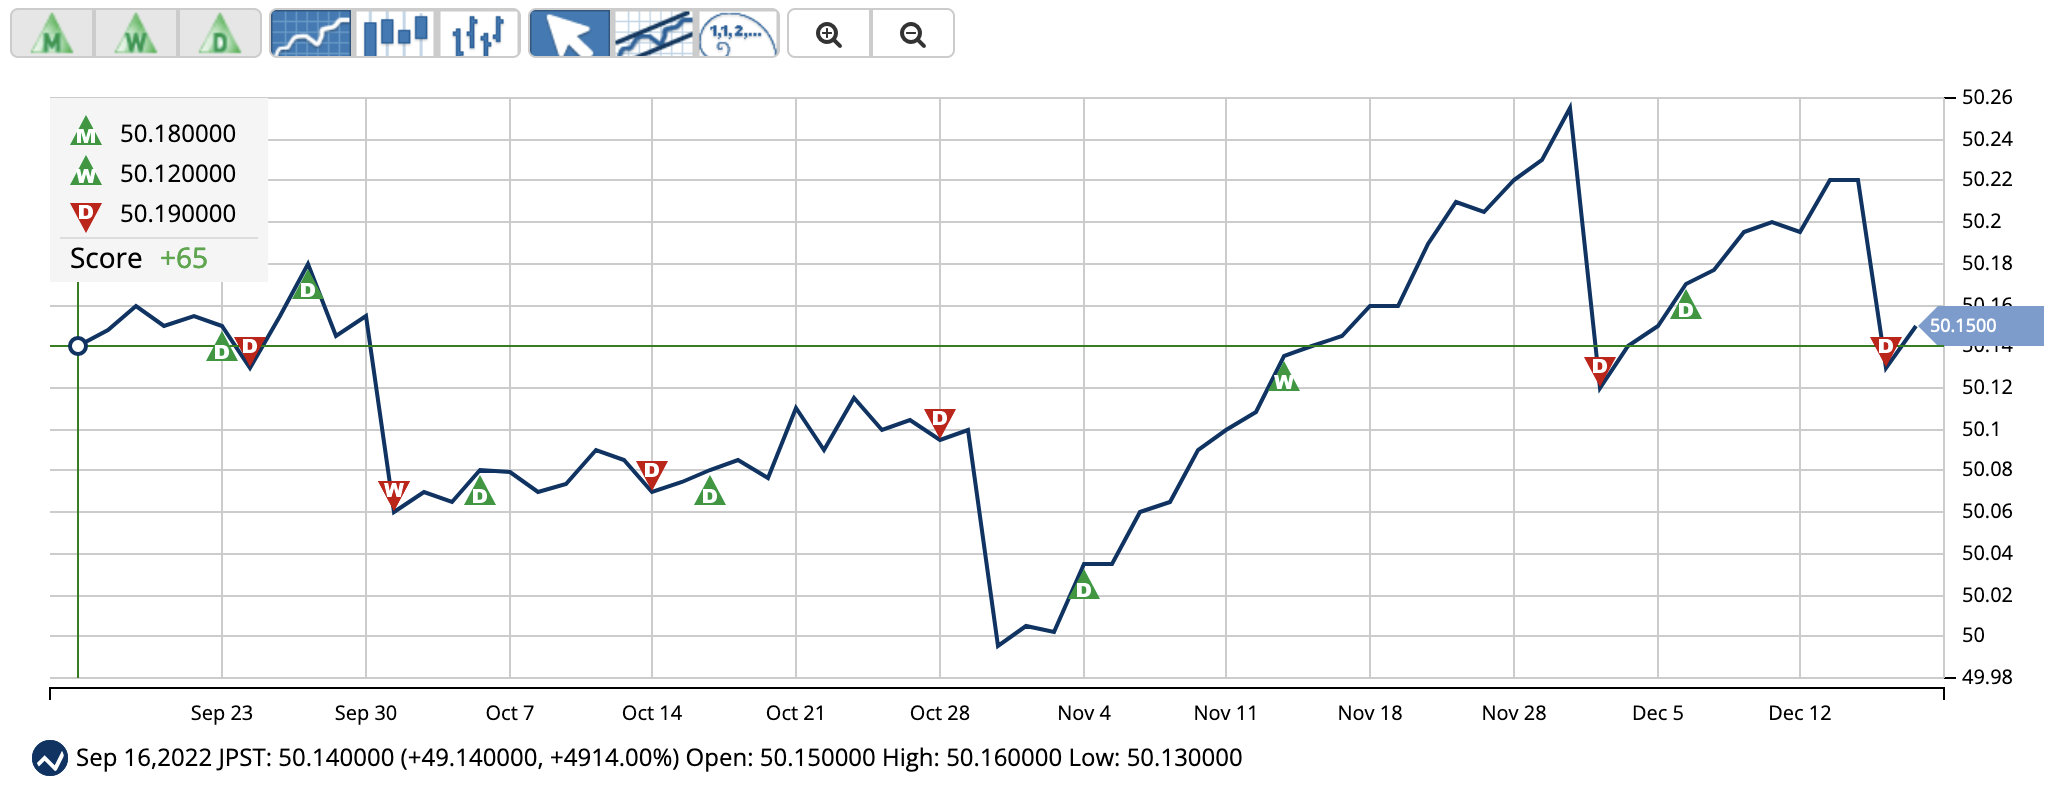
The Trade Triangles are our proprietary indicators, comprised of weighted factors that include (but are not necessarily limited to) price change, percentage change, moving averages, and new highs/lows. The Trade Triangles point in the direction of short-term, intermediate, and long-term trends, looking for periods of alignment and, therefore, intense swings in price.
In terms of the Chart Analysis Score, another MarketClub proprietary tool, JPST scored +65 on a scale from -100 (strong downtrend) to +100 (strong uptrend), indicating signs of weakening momentum to the upside. Monitor JPST as it may be in the beginning stages of a reversal.

The Chart Analysis Score measures trend strength and direction based on five different timing thresholds. This tool takes into account intraday price action, new daily, weekly, and monthly highs and lows, and moving averages.
Click here to see the latest Score and Signals for JPST.
IQ MacKay Municipal Intermediate ETF (MMIT)
MMIT is actively managed to provide current income exempt from federal income tax.
The ETF seeks to enhance total return potential through its subadvisor’s active management approach by investing primarily in investment-grade municipal bonds with a duration between 3-10 years.
MMIT has $338 million in assets under management. The fund has a total of 397 holdings. Its top holdings include Miami-Dade Cnty Fla Tran Sys Sales Surtax Rev 5.0% with a 1.47% weighting, Alamito Pub Facs Corp Tex Multifamily Hsg Rev VAR at 1.18%, New Jersey St Hsg & Mtg Fin Agy Multifamily Conduit Rev at 1.17%, and Jackson Cnty Mo Sch Dist Hickman Mls C-1 5.75% with a 1.13% weighting.
MMIT has an expense ratio of 0.31%, compared to the category average of 0.30%. Over the past six months, its fund inflows came in at $69.23 million.
Also, it has a beta of 0.03. The fund pays a $0.61 per share dividend annually, which translates to a 2.51% yield on the current price.
MMIT has gained 2.7% over the past month to close the last trading session at $24.33. It has a NAV of $24.31 as of December 12, 2022.
MarketClub's Trade Triangles show that MMIT has been trending UP for all the three-time horizons. The long-term trend for MMIT has been UP since December 1, 2022, while its intermediate-term and short-term trends have been UP since November 10, 2022, and November 1, 2022, respectively.
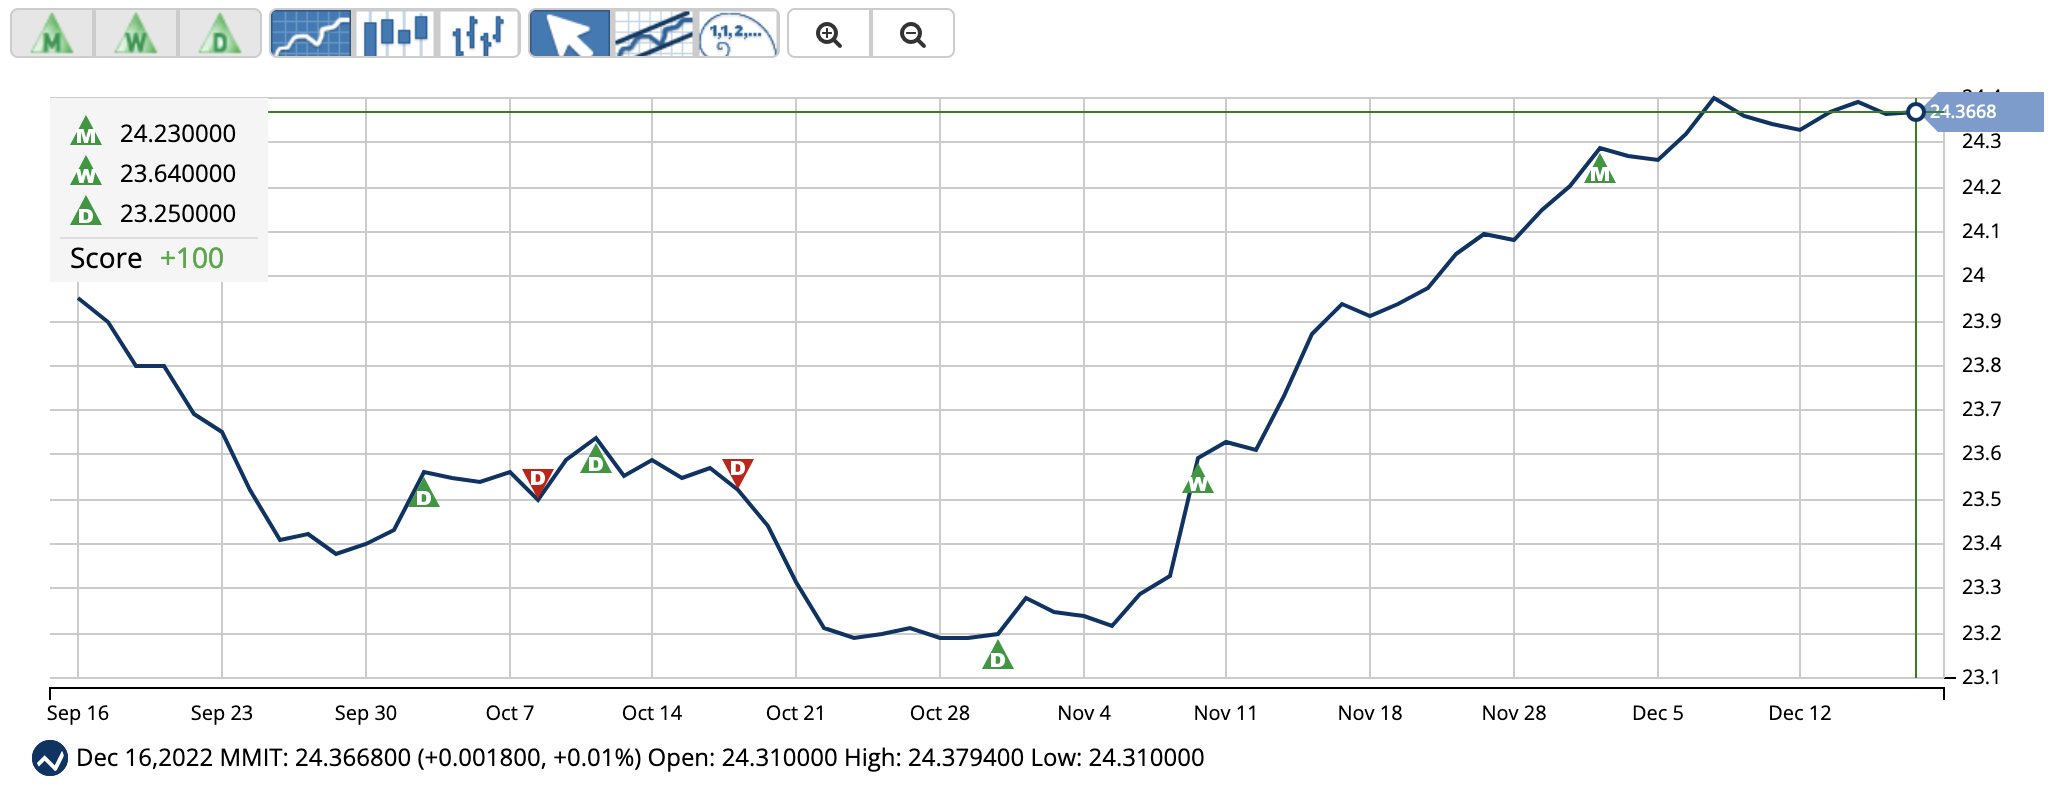
In terms of the Chart Analysis Score, MMIT scored +100 on a scale from -100 (strong downtrend) to +100 (strong uptrend), indicating that the uptrend is likely to continue. Traders should protect gains and look for a change in score to suggest a slowdown in momentum.

Click here to see the latest Score and Signals for MMIT.
VanEck Long Muni ETF (MLN)
MLN tracks a market value-weighted index of investment grade, tax-exempt US municipal bonds.
Municipal bonds are used by local entities to pay for various services or to make improvements to infrastructure, paying for everything from new sewer systems to bridge construction.
This fund targets bonds with nominal maturities of at least 17 years, giving the fund a higher-risk profit and greater current income potential.
MLN tracks ICE Long AMT-Free Broad National Municipal Index. With $251.30 million in assets under management, the fund’s top holdings include U.S. Dollar with a 4.59% weighting, followed by Massachusetts St Dev Fin Agy Rev 5.0% at 0.76%, and Triborough Brdg & Tunl Auth Ny Revs 5.0% and Austin Tex Elec Util Sys Rev 5.0%, at 0.63% and 0.57%, respectively.
It currently has 482 holdings in total.
Over the past three months, the ETF’s net inflows were $29.65 million. In addition, its 0.24% expense ratio compares favorably to the 0.30% category average. Also, it has a beta of 0.05.
MLN pays a $0.53 annual dividend yielding 3.01% at the current share price. The fund has gained 4.3% over the past month and 3.4% over the past six months to close the last trading session at $17.76. Its NAV was $17.74 as of December 12, 2022.
According to MarketClub’s Trade Triangles, MLN has been trending UP for two of the three time horizons. The long-term trend for MLN has been UP since December 1, 2022, while its intermediate-term trend has been UP since November 10, 2022. The short-term trend for MLN has been DOWN since December 15, 2022.
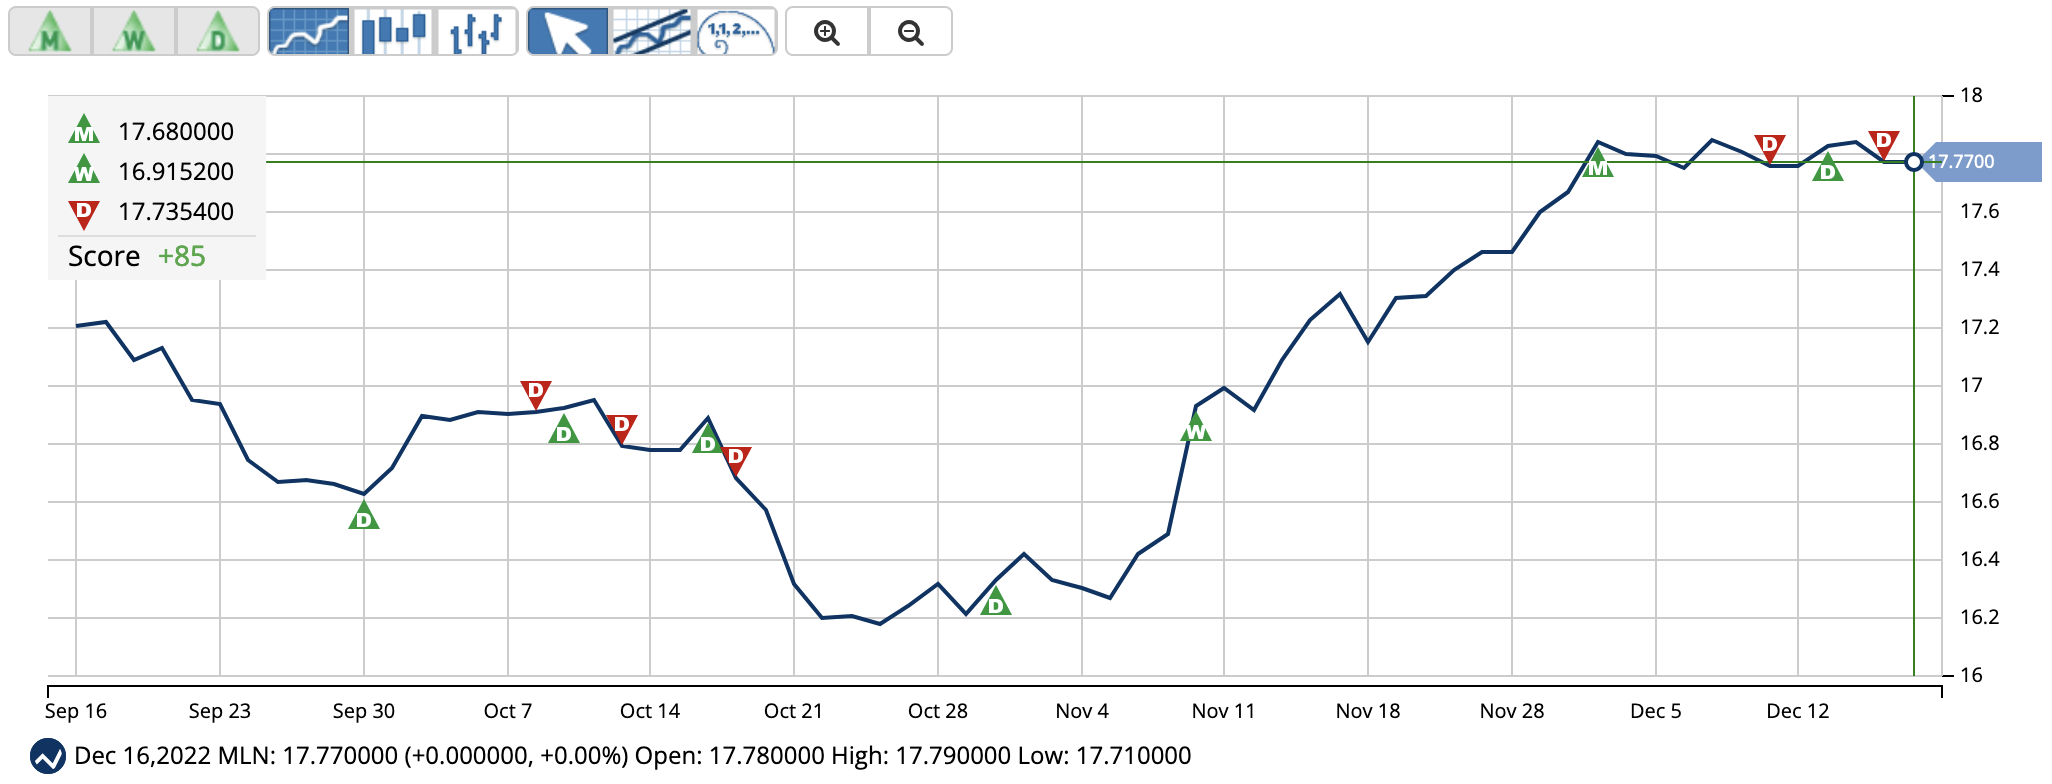
In terms of the Chart Analysis Score, MLN scored +85 on a scale from -100 (strong downtrend) to +100 (strong uptrend), and is showing short-term weakness. However, look for the longer-term bullish trend to resume. As always, continue to monitor the trend score and utilize a stop order.

Click here to see the latest Score and Signals for MLN.
What's Next for These ETFs?
Remember, the markets move fast and things may quickly change for these ETFs. Our MarketClub members have access to entry and exit signals so they'll know when the trend starts to reverse.
Join MarketClub now to see the latest signals and scores, get alerts, and read member-exclusive analysis for over 350K stocks, futures, ETFs, forex pairs and mutual funds.
Best,
The MarketClub Team
su*****@in*.com