
E-commerce and tech giant Amazon.com, Inc. (AMZN) guided a slowdown in sales growth for the holiday season, making investors anxious. The company expects net sales between $140 billion and $148 billion for the year's final quarter, below analysts’ expectations, representing a year-over-year improvement of as little as 2%.
“We are seeing signs all around that, again, people’s budgets are tight, inflation is still high, energy costs are an additional layer on top of that caused by other issues,” Amazon Chief Financial Officer Brian Olsavsky said. “We are preparing for what could be a slower growth period, like most companies,” he added.
AMZN’s shares plunged substantially following the gloomy forecast and are hovering around its 52-week low. The stock has slumped 46% year-to-date to the last trading session at $89.98, well below its 50-day and 200-day moving averages of $116.72 and $130.19, respectively.
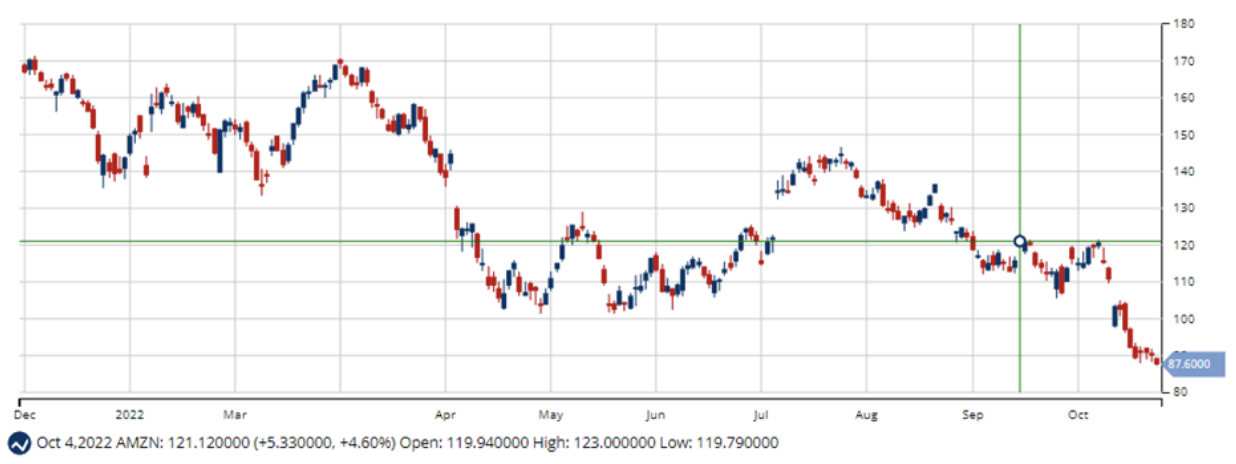
AMZN’s market cap recently slipped below $1 trillion.
AMZN has been trying to navigate the macroeconomic headwinds and hosted two cornerstone sales events in a year: Prime Day in July and the Prime Early Access Sale last month.
Despite registering significant sales in the summer event, the company missed the consensus revenue estimate for the third quarter. Its cloud division, Amazon Web Services, also witnessed sales below expectations.
In addition, a report suggests U.S. online holiday sales will rise this year at their slowest pace since at least 2015, as consumers bear the brunt of sky-high inflation and the Fed’s rate hikes. High inflation and declining consumer sentiments are expected to keep marring AMZN’s growth.
The troubling macroeconomic tides have compelled the e-retailer to control costs across its businesses. The company has slowed warehouse openings and has put a hold on hiring.
Here’s what could influence AMZN’s performance in the upcoming months:
Deteriorating Bottom Line
For the fiscal third quarter ended September 2022, AMZN’s total net sales increased 14.7% year-over-year to $127.10 billion. However, its operating income declined 48% from the year-ago value to $2.53 billion, while its net income decreased 9% year-over-year to $2.87 billion. The company’s EPS declined 9.7% from the prior-year quarter to $0.28.
In addition, its comprehensive income came in at $539 million, down substantially from its year-ago value of $2.61 billion. Free cash flow decreased to an outflow of $19.7 billion for the trailing twelve months, compared with an inflow of $2.60 billion for the prior period.
Bleak Bottom Line Growth Expectation
Analysts expect the company’s revenue to come in at $146.13 billion for the fiscal fourth quarter ending December 2022, indicating an increase of 6.3% year-over-year. Moreover, its revenue is expected to grow by 9.8% in the following quarter and 8.7% in the current fiscal year.
However, the consensus EPS estimate of $0.19 for the ongoing quarter indicates an 86.2% decline from the prior-year quarter. Street expects AMZN’s EPS to come at a negative $0.08 for the ongoing fiscal year.
Premium Valuation
AMZN’s forward EV/Sales of 2.01x is 84.9% higher than the industry average of 1.09x. Also, its forward Price/Sales and Price/Book of 1.80x and 6.17x compare to the industry averages of 0.83x and 2.51x, respectively. Its forward Price/Cash Flow multiple of 18.58 is 74.8% higher than the industry average of 10.63.
Lackluster Profitability
AMZN’s EBIT margin of 2.58% is 68.1% lower than the industry average of 8.10%, while its net income margin of 2.25% is 57.2% lower than the industry average of 5.27%. Moreover, its levered FCF margin of negative 2.53% compare to the industry average of 1.43%.
In addition, its ROE, ROTA, and ROTC of 8.78%, 2.64%, and 2.90% compare to the industry average of 14.31%, 4.82%, and 6.65%, respectively.
Weak Technical Indicators
AMZN’s solid market position and global presence are expected to help the company revive its fundamentals. However, given the current macroeconomic backdrop and deteriorating sentiments, the stock has been on a downtrend.
According to MarketClub’s Trade Triangles, AMZN’s long-term trend has been DOWN since October 13, 2022, and its intermediate-term trend has been DOWN since August 22, 2022. Moreover, the stock’s short-term trend has been DOWN since October 27, 2022.
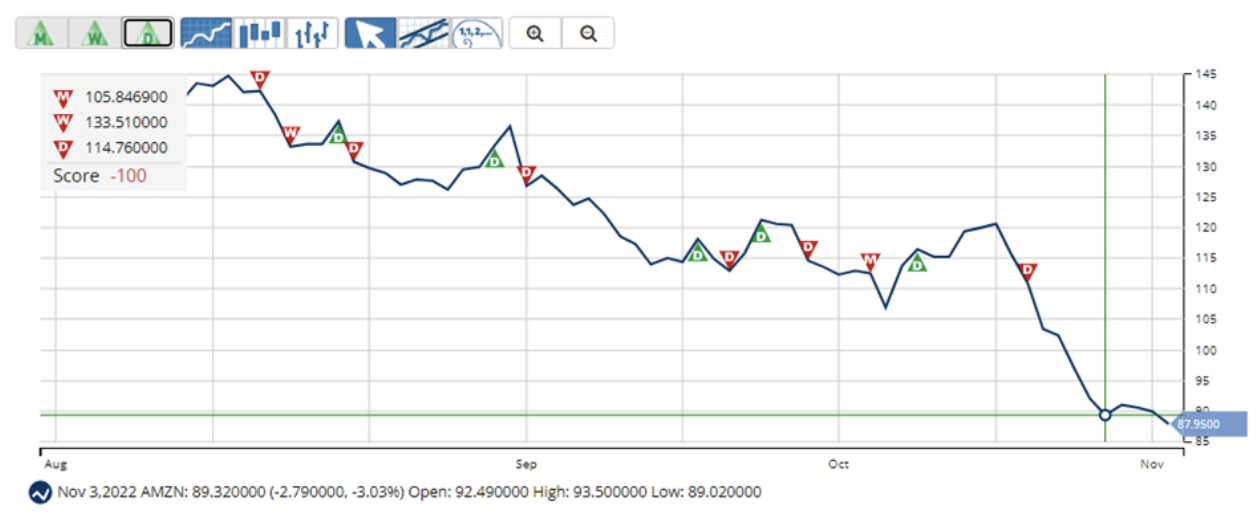
The Trade Triangles are our proprietary indicators, comprised of weighted factors that include (but are not necessarily limited to) price change, percentage change, moving averages, and new highs/lows. The Trade Triangles point in the direction of short-term, intermediate, and long-term trends, looking for periods of alignment and, therefore, intense swings in price.
In terms of the Chart Analysis Score, another MarketClub proprietary tool, AMZN, scored -100 on a scale from -100 (strong downtrend) to +100 (strong uptrend), indicating that the downtrend will likely continue. Traders should use caution and set stops.

The Chart Analysis Score measures trend strength and direction based on five different timing thresholds. This tool considers intraday price action; new daily, weekly, and monthly highs and lows; and moving averages.
Click here to see the latest Score and Signals for AMZN.
What's Next for Amazon.com, Inc. (AMZN)?
Remember, the markets move fast and things may quickly change for this stock. Our MarketClub members have access to entry and exit signals so they'll know when the trend starts to reverse.
Join MarketClub now to see the latest signals and scores, get alerts, and read member-exclusive analysis for over 350K stocks, futures, ETFs, forex pairs and mutual funds.
Best,
The MarketClub Team
su*****@in*.com