
Top metals failed to keep on the bullish track set earlier. A heavy-duty dollar reinforced by historically high inflation, earlier tapering expectations, and a turn to safety puts pressure on precious metals.
Let us see what is currently happening with the Dollar Index in the daily chart below.
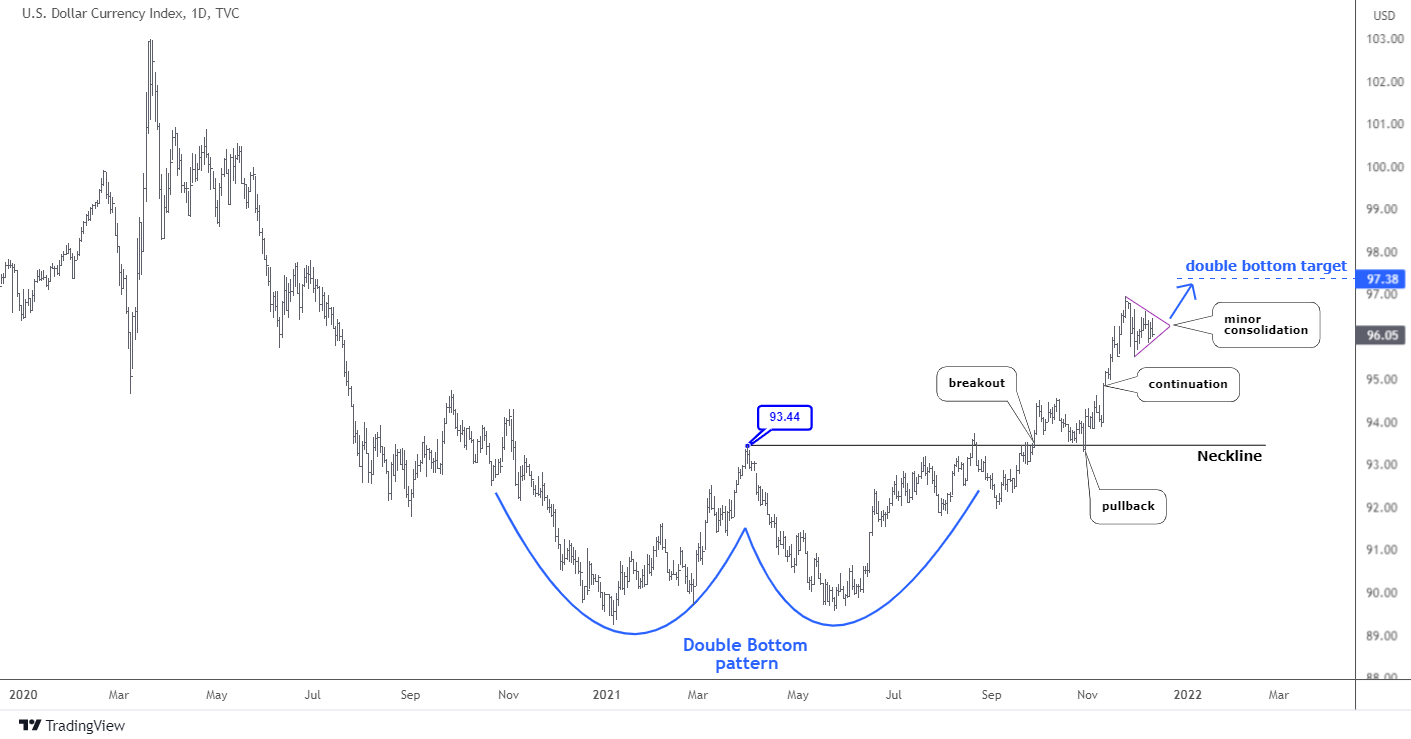
The well-known "Double Bottom" (blue) pattern has emerged in the summer. It is a textbook case as all stages went precisely as they should appear.
The focus was on the breakup of the so-called "Neckline" (black horizontal line) located at the top between the two bottoms at $93.44. The first attempt to crack that level occurred at the end of August, but it failed. After a small retracement, the second attempt at the end of September succeeded in breaking out. The impulse was so strong that the price overshot the Neckline with a big margin to hit the fresh one-year top of $94.5.
The next stage was a pullback to a broken Neckline, and it was done neatly. The price slightly pierced the former barrier and reversed to the upside at once.
The continuation stage is still in progress until it reaches the ultimate target. The former is located at a depth of the smallest bottom (conservative approach) added to the price of the Neckline. I marked it with a blue dashed line at $97.38. The highest price seen so far was $96.94; it was close.
These days, the DXY has been locked within a potential minor triangular consolidation (purple) ahead of another strike to the upside to complete the mission. On the other hand, another round of rising dollar could push precious metals lower in the near future.
What if this model could be a game-changer in a bigger chart as a part of some larger structure? Before we move on to an updated large map, I would like to refresh your memory with the earlier considered options in the old monthly map posted last September with the title "Gold & Silver: The King Reins In" .

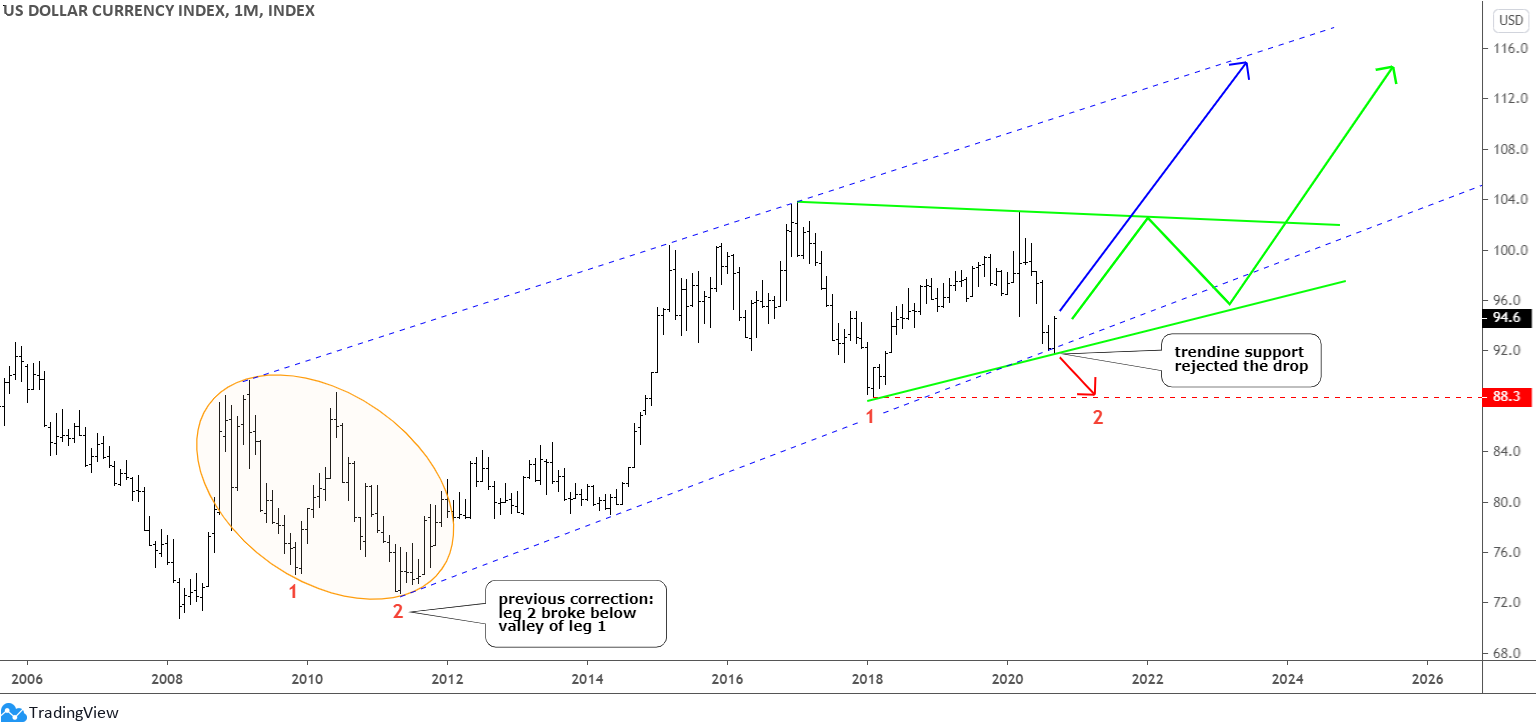
That time, I proposed three options: red to the downside to complete the red leg 2, green triangular consolidation, and blue non-stop growth.
The return of the price into the blue uptrend and the current strong progress could have eliminated the red option, which ranked the second among your votes. The major bid has been placed on the green option of large triangular consolidation.
This time, I compressed the monthly chart below even more to let two maps in.
The red path down was excluded, and we have only two scenarios left; both are bullish. The green path of the triangle implies some minor progress to the upside to hit the target shown in the first chart above. Then, there should be a retracement ahead of a final rally to the upside. One should watch two invalidation levels located at the closest opposite extremes: at $103 on the upside and at $89.2 on the downside. The final target is the same for both paths at $121.02.
The blue path reflects the ongoing strength of the dollar to hit the next barrier at $121.02. This path will be confirmed on the breakup of the former top of $103.82. This could trigger a sell-off in peer currencies and precious metals.
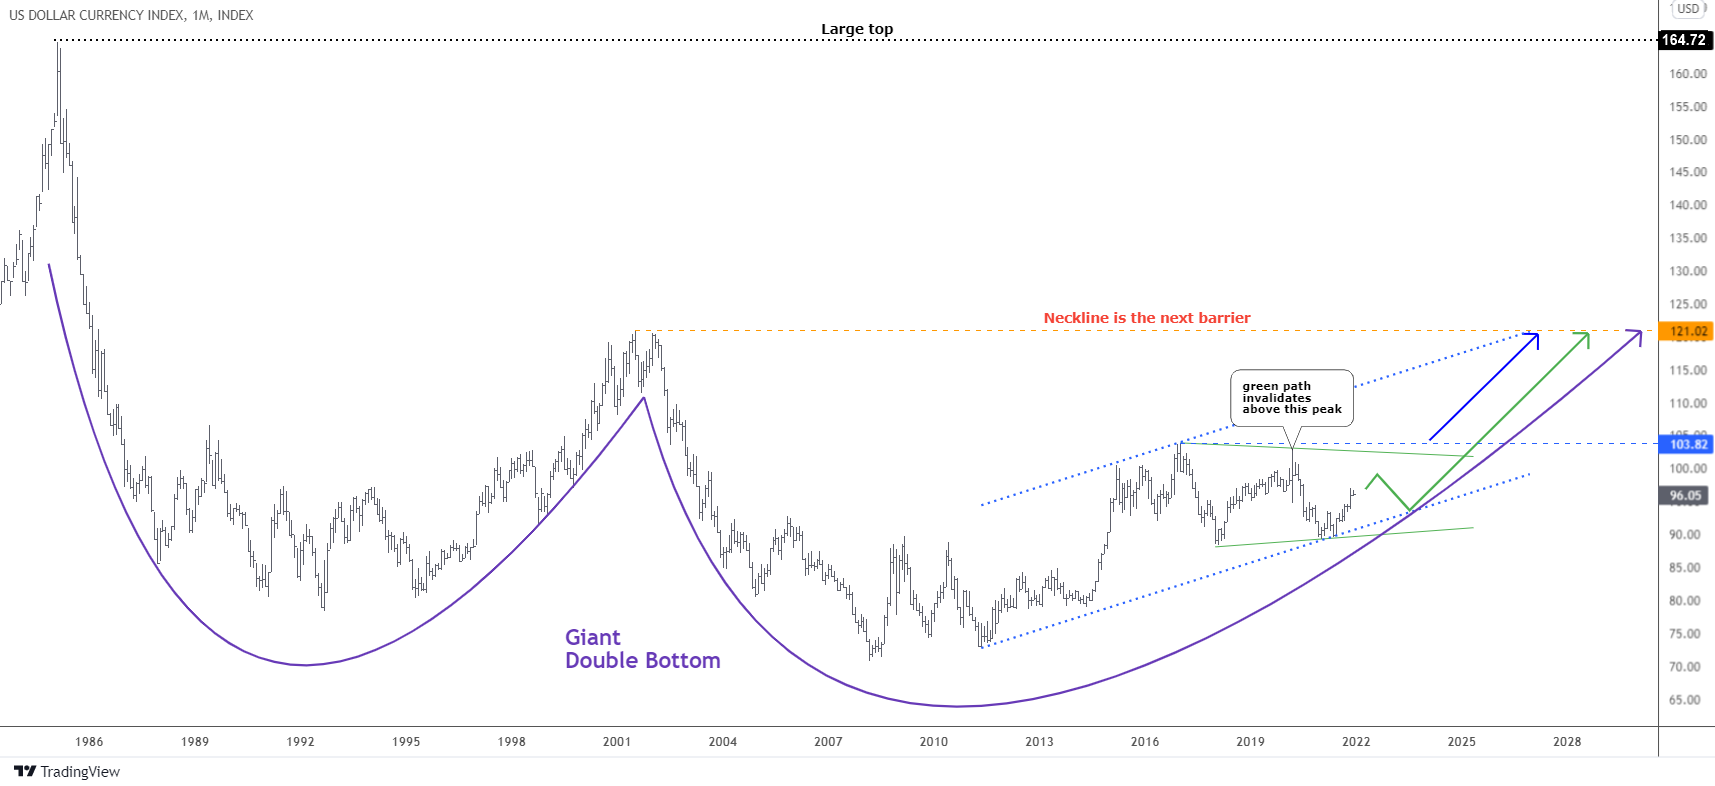
This time I shrank the chart enough to reveal to you the hidden left part for extended view. A potential giant Double Bottom (purple) could be emerging in the background. Now, the large magnifying barrier of $121.02 looks logical as it is the Neckline of the pattern.
It is hard to imagine these days; however, if the DXY could manage to break beyond the barrier, then the next large top of $164.72 will be aimed. The level that has not been seen for almost 37 years! It coincides with the target calculation of a giant Double bottom pattern even if we take the depth of the left smaller bottom to be conservative.
This move would send many assets into an abyss, but the reason for such a strong dollar could be terrifying as so massive run to safety is abnormal. So another option is an attractive yield on dollar-denominated assets, which means an extremely high-interest rate. In February 1985, when the DXY established that major top at $164.72, the United States Fed Funds Target Rate was around 8%.
Intelligent trades!
Aibek Burabayev
INO.com Contributor, Metals
Disclosure: This contributor has no positions in any stocks mentioned in this article. This article is the opinion of the contributor themselves. The above is a matter of opinion provided for general information purposes only and is not intended as investment advice. This contributor is not receiving compensation (other than from INO.com) for their opinion.