U.S. dollar index (DXY) 4-hour chart
Last time the chart structure of the dollar was less clear; hence I put two opposite scenarios in the chart with triggers.
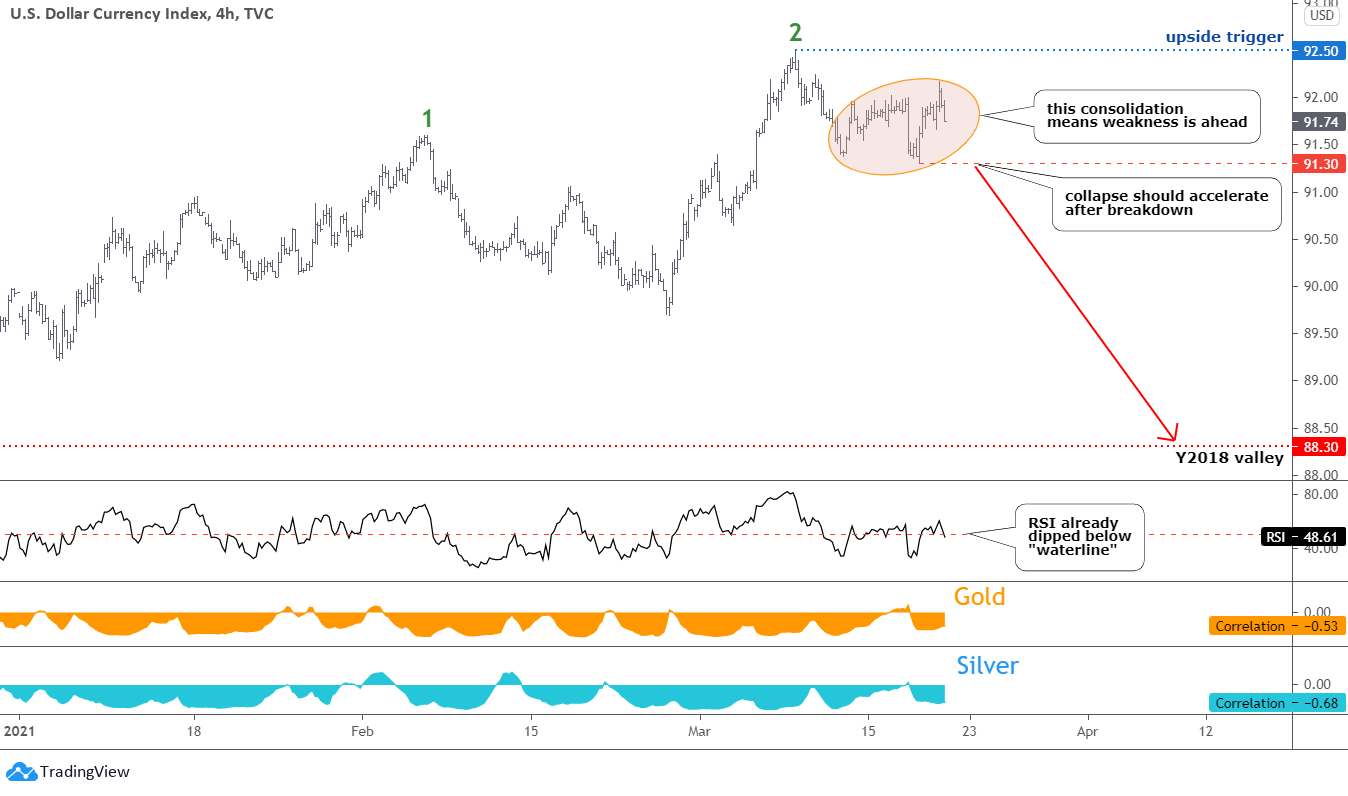
As time goes by, the market reveals itself more clearly. The DXY price built a familiar two-leg consolidation highlighted with the orange ellipse. It follows the preceding move down from the recent peak of green leg 2. It means further weakness is ahead. I put the trigger on the 91.30 mark (bottom of the minor consolidation) for confirmation. The target remains intact in the area of the Y2018 valley.
The RSI shaped the same two legs up, and then it dropped below the “waterline,” giving the first bearish signal.
Last time, most of you projected the Bearish scenario for the dollar, and now it is coming to the truth. My congratulations on your accurate prediction!
The normal negative correlation of gold is almost at the same level, and silver is more inversely correlated this time.
Both metals also have a clearer structure in the charts these days.
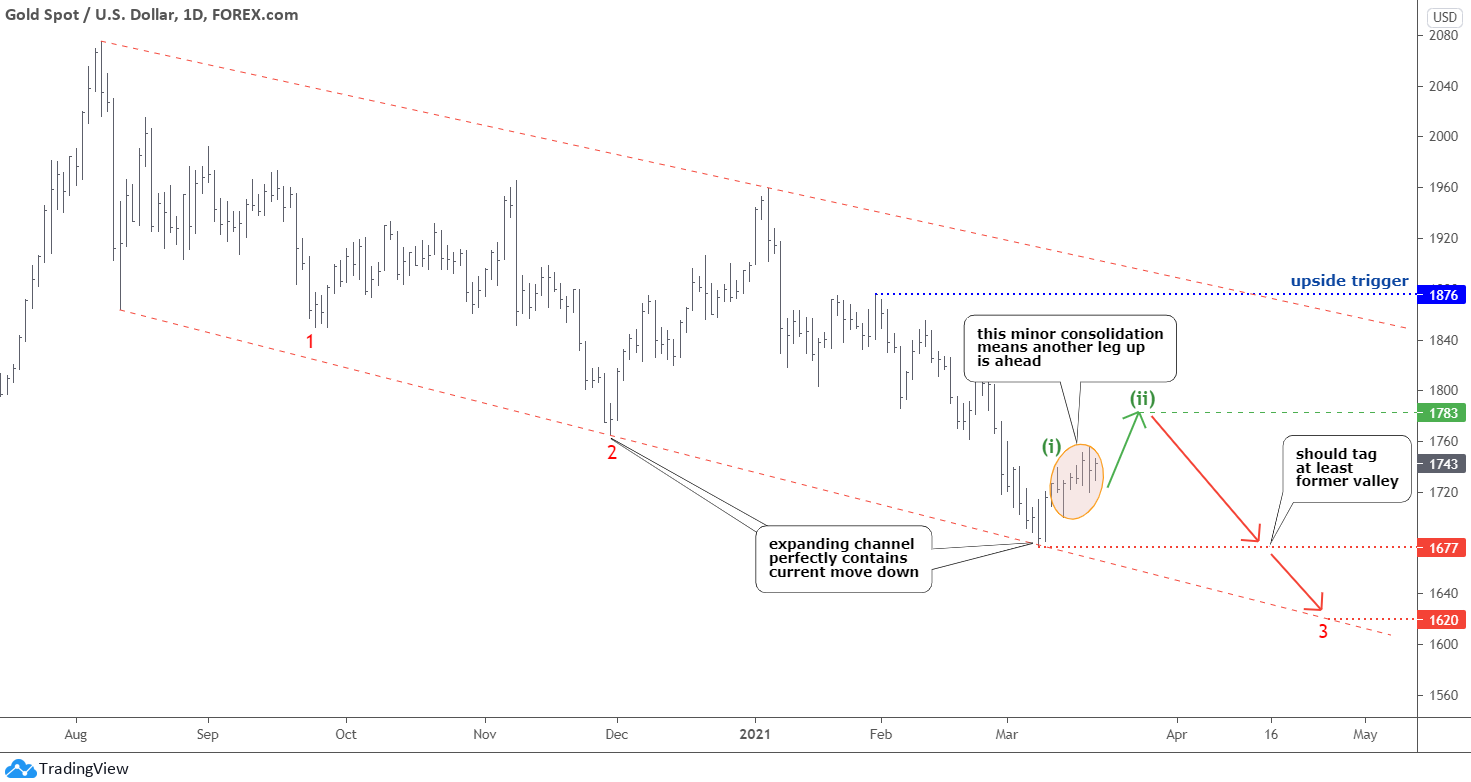
Gold follows the plan that was posted at the beginning of the month. I expected the throwback highlighted with the red zigzag. This time we can distinctly see the internal structure of it.
See This Week's Stock Pick
Our experienced analyst carefully scours financial publications, balance sheets, press releases, charts, live events, and more to locate the most liquid, undervalued, and overlooked stocks.
The orange minor consolidation shows that the green leg (i) to the upside was completed, and we should expect further strengthening of the metal within the next leg (ii) up. The equal distance will be reached when the price would hit $1783.
Another drop should follow subsequently to retest at least the former valley of $1677. The touchpoint of the downside of the channel is located lower in the area of $1620. I replaced the parallel channel with the expanding channel as both trendlines were built independently through the relevant peaks and troughs. It perfectly contains the current move down, and the logic behind the former valley is clear now.
Previously, the majority of you agreed that gold would drop more.
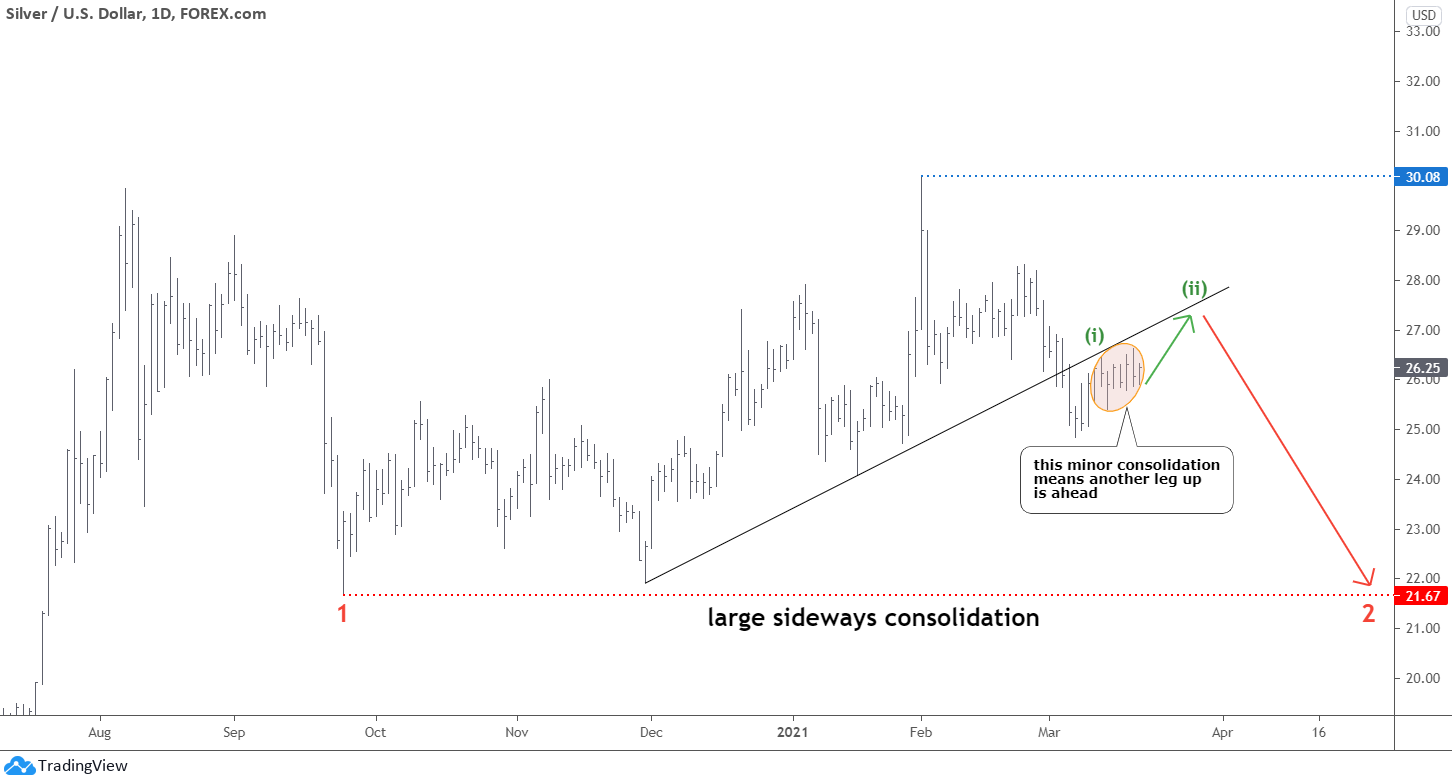
The two-leg corrective structure is emerging in the silver chart as well. We have the first move up marked as (i) and an orange consolidation. The next leg (ii) to the upside is going to hit the $27.5 area and retest the former trendline support (black). This is a beauty of chart structure - both projection of leg (ii) and the touchpoint of the resistance align perfectly!
After leg (ii) completes, the long-awaited collapse should follow to tag the $21.67 area.
Most of you remain bullish on silver, however, already 41% see the drop, and I guess those who want to buy the metals cheaper.
Intelligent trades!
Aibek Burabayev
INO.com Contributor, Metals
Disclosure: This contributor has no positions in any stocks mentioned in this article. This article is the opinion of the contributor themselves. The above is a matter of opinion provided for general information purposes only and is not intended as investment advice. This contributor is not receiving compensation (other than from INO.com) for their opinion.


