The summer sure has flown by. It was full of events, and we got a new all-time high gold price then. The fall should be an interesting season, as well as “The Volcano Awoke” for precious metals and more “eruptions” are expected ahead.
I updated the charts for you below, and the US dollar index (DXY) daily chart will open this post.
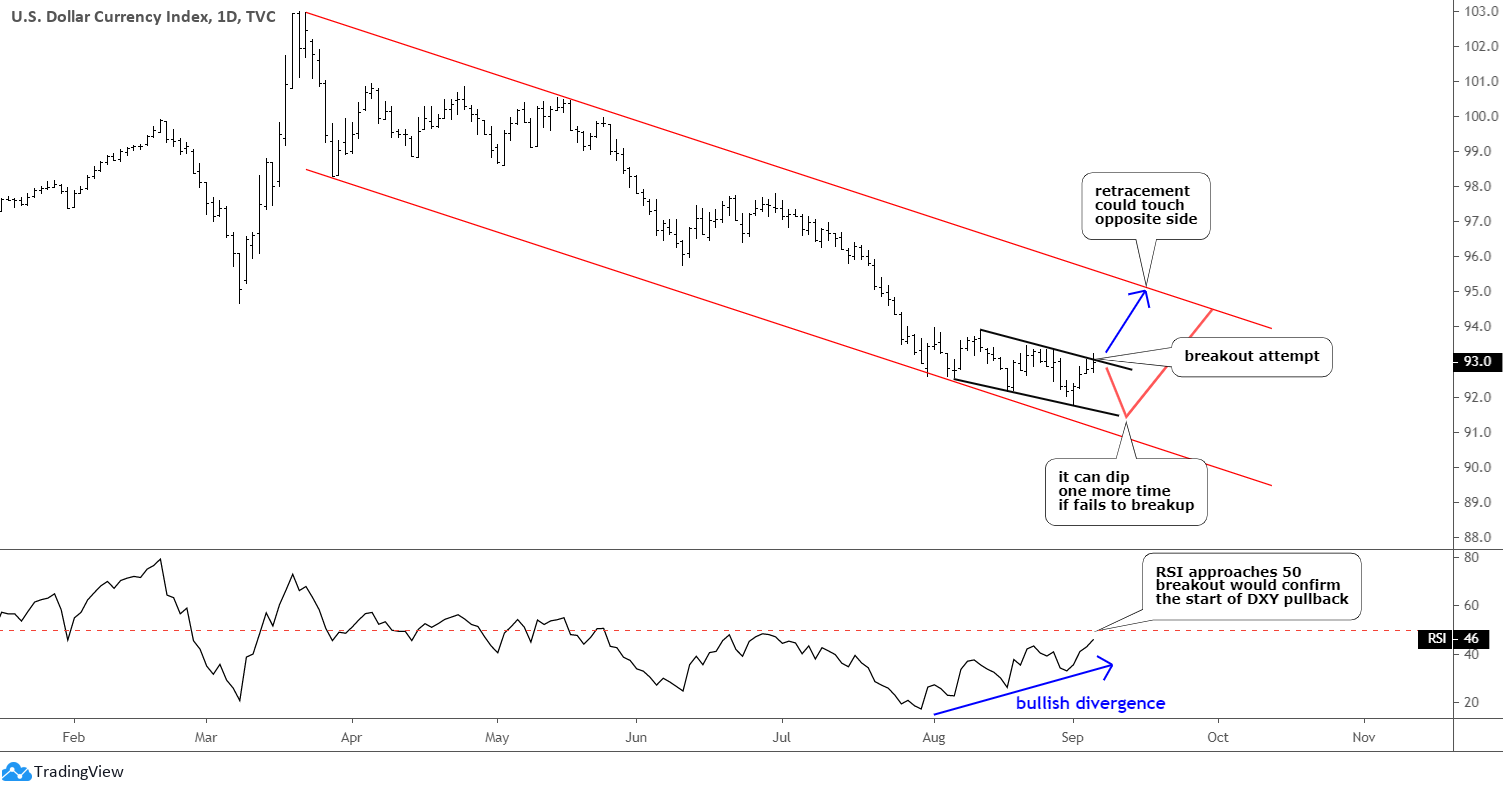
The majority of readers voted earlier that the dollar index will reach the upside of the red trend channel. The second most popular choice that DXY will not exceed the former top of 94 and continue down (Extremely Bearish) paid well as price indeed couldn’t overcome that barrier and dropped again. Then there was another attempt, and another drop as the chart structure has shown seesaw moves within a black channel. It affected the precious metals price as they have been trapped in the sideways zigzags as well.
Look at the RSI sub-chart; it built an even stronger Bullish divergence as another zigzag has a higher valley and a higher top compared to a lower trough and a lower peak in the price chart. It is approaching the crucial 50 level now, and if it breaks it to the upside, then the long-anticipated pullback will finally emerge. The price is already drilling that black channel’s upper side, and the former top of 93.5 is at risk now. That throwback could reach the opposite side of the red downtrend around 95. If the breakup fails, then another drop could follow to retest the downside of the black channel.
The precious metals continue to consolidate within the boundaries of the first drop, and it offers us an opportunity to take a closer look inside that mysterious consolidations. For that purpose, I switched to a lower 4-hour time frame.
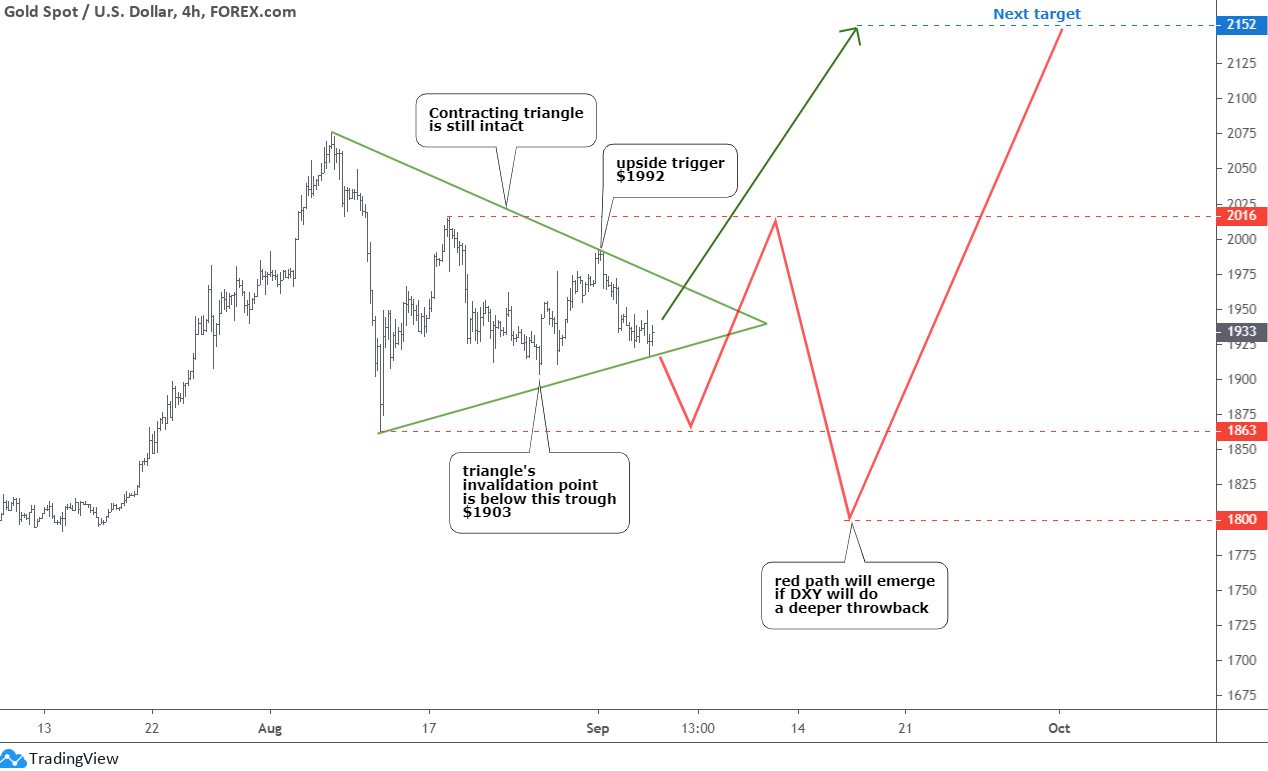
Most of you voted earlier for the green triangular option for the emerging consolidation in gold. It is still intact, as you can see in the chart above. It has the contracting structure with falling peaks and rising troughs. The former valley at $1903 is the invalidation trigger for this option, and it was almost reached last week. The immediate move to the upside is needed to save this option; it has a promising outcome as the price will move straight to the target then. It should overcome the former top of $1992 for confirmation.
The second most popular choice was the red path of a zigzag down. I kept it here as it is still valid, but I altered it to an extended version as we got the possible complication of the joint between two legs down. I expect it to build the box-type structure before another drop appears. The range of it is between $1863 and $2016. The final move down could reach the round number level of $1800. The background of a possible US dollar strength shown in the first chart above could facilitate this deeper correction.
I excluded the orange option of the original idea of a sideways consolidation, which scored the 3rd place and kept only two scenarios.
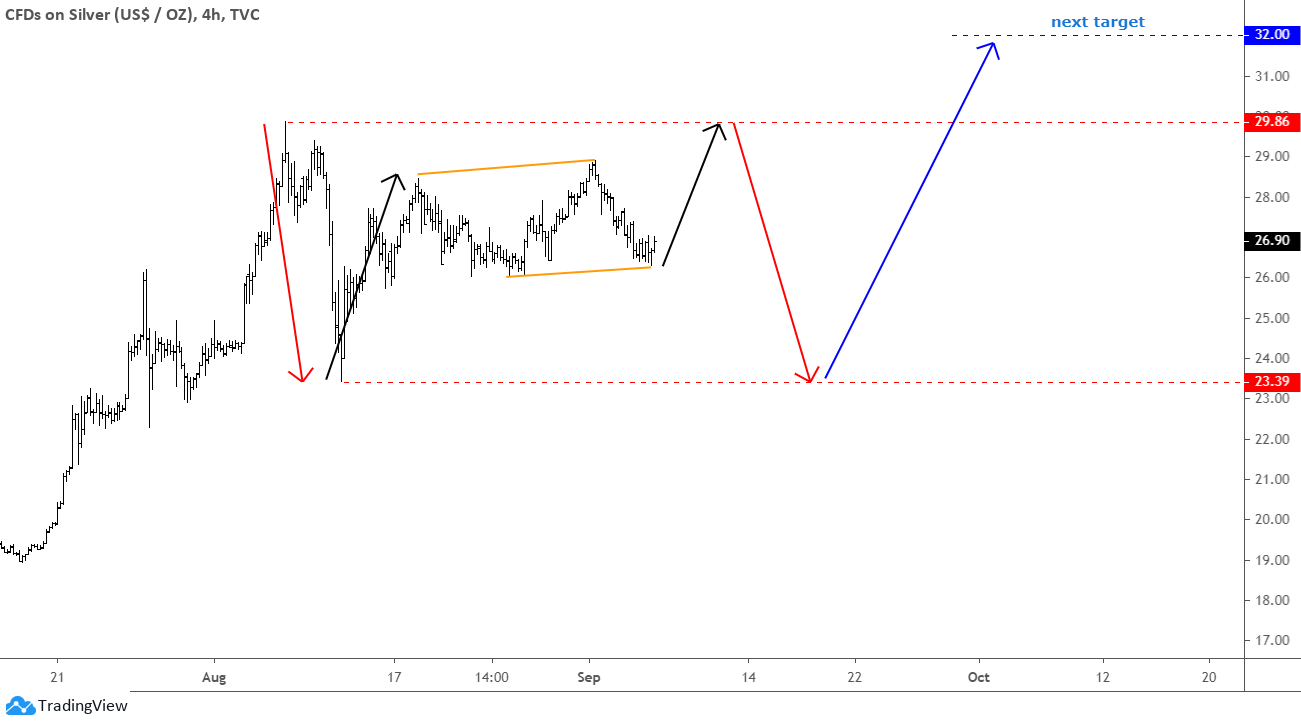
The green triangular option for silver also gained the most in my earlier post as it did for gold. It was invalidated, as you can see on the chart above, as the market has built the extended horizontal structure instead, and the former peak was broken to the upside last week. Silver already had a clearer structure last time, and now I can see only the orange option of the original idea of a sideways consolidation, which was the second popular bet of yours.
I took this chance to make a detailed educational drawing for you as we got more space with a single path. This is a complex correction. Price has already built the first big sharp leg down (left red down arrow). Then we got a strong rally within the first move up (left black up arrow) of the large joint between two moves down. After that, the silver made a slightly up-sloping consolidation (orange trendlines). Now I forecast the second leg up to retest the former top of $29.86 (right black up arrow). It will complete the retracement of the first leg down. Then another drop should complete the entire consolidation making the shape of an ideal rectangle. It should retest the valley of the first leg down at $23.39. The up blue arrow shows the continuation of the bullish trend after we will finish that complex correction.
Intelligent trades!
Aibek Burabayev
INO.com Contributor, Metals
Disclosure: This contributor has no positions in any stocks mentioned in this article. This article is the opinion of the contributor themselves. The above is a matter of opinion provided for general information purposes only and is not intended as investment advice. This contributor is not receiving compensation (other than from INO.com) for their opinion.


Gold; silver : bet on them: dollar going down
I see a bull flag on the daily chart with the consolidation ending in the next few days and then re-testing the blue sky..........
Dear Dyrl, I see what you mean, the minor structure that was already broken up, thanks for heads up!
Where is the best place for someone newly starting out and would like to test the waters being able to select specific stocks of my choosing? I am not interested in joining ANY services with “membership fees”. I simply want to be able to purchase and sell stocks at my leisure without joining any pay service. Thank you in advance!
good luck
will silver make to $100. mark?
Dear wil, let's do some math, if we take $2500 per ounce as some ultimate target for gold then if we divide $2500 (gold) by $100 (silver) it gives 25 oz. of gold/silver ratio, which is currently standing at 72 oz. We can't say its impossible but it can take quite a long time to reach there.
If the stock market makes new highs silver will out perform gold and take the lead and out perform gold. Its industrial value will increase its value. Now if we go into a deep recession all bets are off and the metals will retreat with all other,market investments and the dollar and cash instruments will be the place most investors will put there money and lick there wounds. The professional short seller will be taking the money on the way down. The market holds no prisoners. It will happen when nobody expects. It will probably start the day after the election. Its long over due, its going to be real nasty. but swift, with trillions changing hands. I have silver now over 35 years. first purchase bought 5- 100 ounce bars a $400 each $4.00 ounce. been buying silver for years have enough. stopped buying in 2010. Silver is a bad investment been control by big business and will always be manipulated. I see copper catching up to silver. Fake out Silver will always be a disappoint.
Dear Carl, I see your point. Long ago I posted a correlation of gold/silver ratio and S&P 500 as the former reflects the risk on/off appetite. The recent rally of the index wasn't supported with the ratio as it exceeded 100 oz showing a risk off side. Both metals are in demand as helicopter money destroys the value of fiat. I wish you a good luck! Thanks for sharing
I don't think gold would drop much or any below 1900, but I do believe it will go up to 2235 and possibly 2300 about the time of the election. After that it will correct for the rest of the year.
Dear Mr.Thompson, thank you for sharing your view. Your targets could be achievable as we got zero rates, trade war and a lot of uncertainty ahead. Let's live and see!