
Both metals missed the time targets, which were set on the 13th of December for gold and on the 20th of December for silver in the previous post as I was expecting the Last Drop Ahead Of Santa Claus Rally.
I updated the charts below and went deep into the anatomy of the current consolidation in the "bc” segment to show you in detail what holds the price for so long delaying the last drop. For that reason, I switched to a lower time frame of 4-hour.
Let me start with the silver chart as it has a less complicated structure than gold, and I will use it as a navigator.
Chart 1. Silver 4-hour
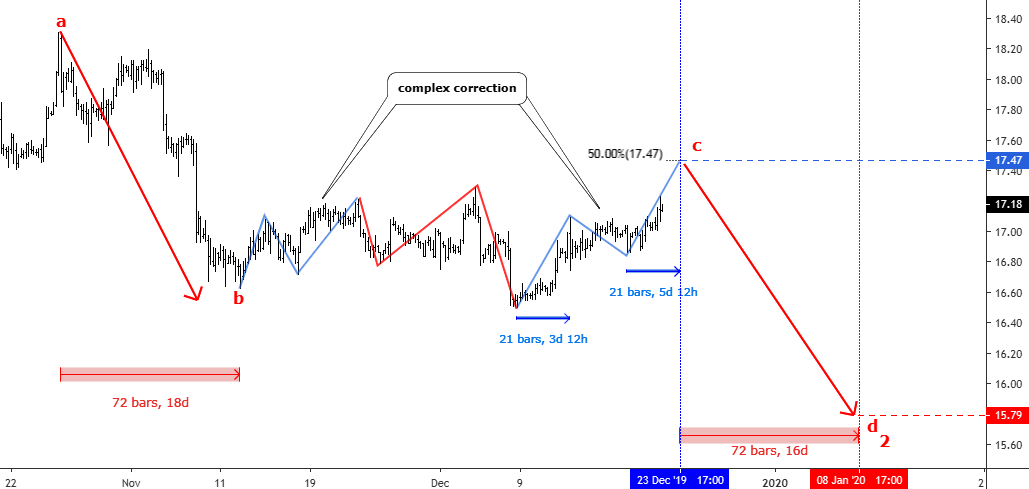
Chart courtesy of tradingview.com
Corrective structures are tricky as I always repeat it as a mantra, but it really has such a nature as it reflects the uncertainty in the market mixed with attempts of different market forces to break out of the current status quo. This creates sharp zigzags and false breakouts as we see it on the silver chart above.
The '"bc" move gets more complicated than I thought before. This time I put the colored zigzags for each element. Blue zigzags show counter-trend moves to the upside. It was connected with the red zigzag, which has a pretty wild structure with very sharp moves in opposite directions.
It looks like we are on the last move to the upside within the second blue zigzag. Assuming the equality of two ascending parts of it, we can find both time and price targets. The former is located at $17.47. Interestingly, the 50% Fibonacci retracement is also right on that level. The latter is set at the end of Monday, December 23, 2019.
If this "c" point comes true, then the "cd" segment could reach the $15.79 level on January 08, 2020. Bears are safe below $18.31 apex of this second leg down.
Chart 2. Gold 4-hour
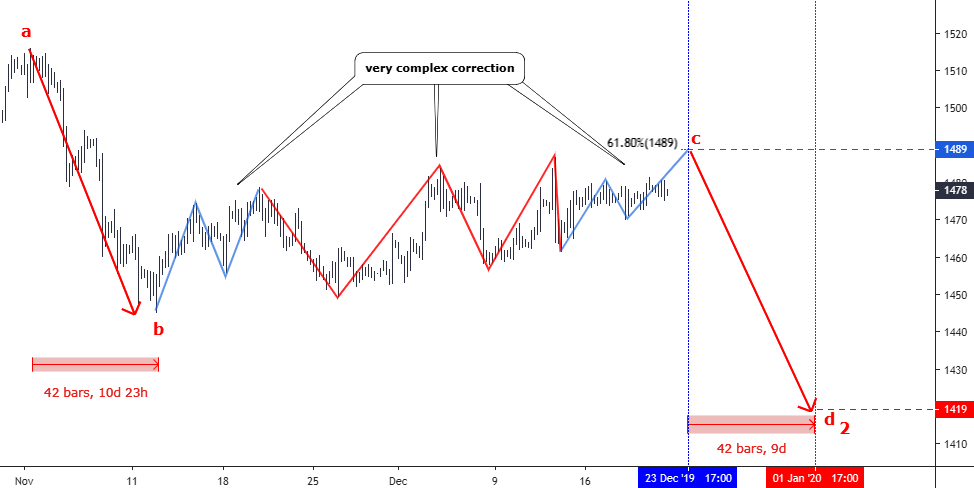
Chart courtesy of tradingview.com
It looks like gold ignores short term time targets set before as it moves according to the initial time plan, which was set last month when I warned you of extended consolidation as we are approaching Christmas day and the last drop is still pending.
The "bc" consolidation is much more complicated compared to the silver chart as it unfolds within 11 parts. The most complex and tricky is the red zigzag, which connects blue upside zigzags as it contains the junction as well. That's what makes it so complicated. Gold has strong demand from the institutional side and this supported the price so far as this metal couldn't break below the previous low of $1446 when silver did. That is why the yellow metal shaped more zigzags.
This time again, the silver has a clearer structure as gold's last move up in the second blue zigzag already ran out of time and I applied silver's time target, which falls on the end of Monday, December 23, 2019. The price target is located at the $1489 and the 61.8% Fibonacci retracement level is precisely at the same level. Gold's consolidation is deeper as silver retraced only half.
If the calculated "c" point is correct, then the "cd" segment could drop to the $1419 level on January 02, 2020. This scenario will be invalidated on a break of the top of this second leg down at $1516.
Intelligent trades!
Aibek Burabayev
INO.com Contributor, Metals
Disclosure: This contributor has no positions in any stocks mentioned in this article. This article is the opinion of the contributor themselves. The above is a matter of opinion provided for general information purposes only and is not intended as investment advice. This contributor is not receiving compensation (other than from INO.com) for their opinion.
GOLD S/L 1480.00 I AM SEEL THEN YDU WANT ????? S/L
So Aibek... with gold futures printing an intraday high today (on 12-27) of 1519.85, I'll assume that that counts as "a break of the top of this second leg down at $1516."
I'm curious what your opinion is now.
Break down -cd- possibly to start in january......
I am staying with the on hold Jan/Feb 2020