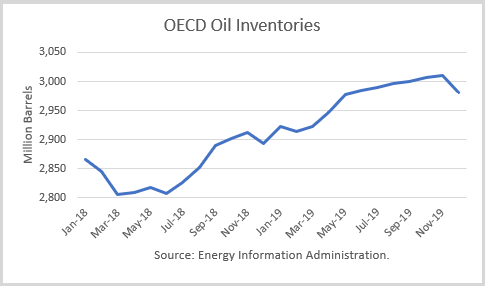
The Energy Information Administration released its Short-Term Energy Outlook for December, and it shows that OECD oil inventories likely bottomed in March at 2.807 billion barrels. It estimated a 10-million barrel gain for November to 2.902 billion. Though it forecasts that stocks will drop in December to 2.894 billion, that is 50 million barrels higher than a year ago.
Throughout 2019, OECD inventories are generally expected to rise, reaching 3.010 billion barrels in November. Its projections end the year with 88 million barrels more than at the end of 2018, glut territory.

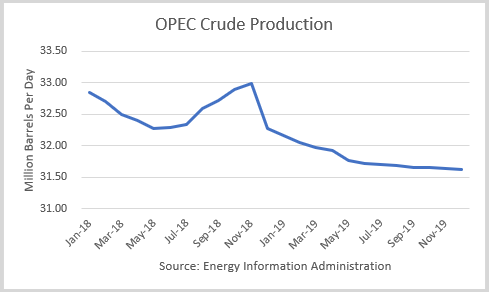
OPEC pledged to cut its production by 800,000 b/d from the October level for the first six months of 2019. EIA estimates OPEC production at 32.9 million barrels per day (mmbd), including Qatar, which will no longer be a member of OPEC in January. EIA’s assume OPEC production for 2019 is 31.8 mmbd, and so that represents a larger 1.1 mmbd drop.

Oil Price Implications
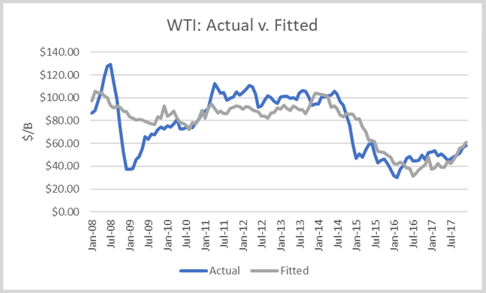
I performed a simple linear regression between OECD oil inventories and WTI crude oil prices for the period 2008 through 2017. As expected, there are periods where the price deviates greatly from the regression model. But overall, the model provides a reasonably high r-square result of 79 percent.

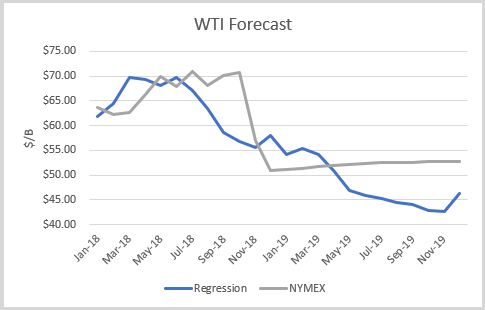
I used the model to assess WTI oil prices for the EIA forecast period through 2019 and compared the regression equation forecast to actual NYMEX futures prices as of December 10th. The result is that crude oil futures prices are undervalued for the next several months but overvalued for April forward. Later in 2019, oil prices would drop into the low $40s if these inventories are realized.

Conclusions
The total OPEC+ production cut announced was 1.2 million barrels per day, with 400,000 b/d coming from non-OPEC countries. The interesting part is that Russia has said its share will come gradually over the next six months and no non-OPEC countries have announced a cut. Therefore, global oil stocks may build even faster than the 28 million barrels build EIA projects for January.
As indicated above, these trends would create a new global oil glut in 2019. Furthermore, the U.S. outlook does not appear to incorporate a surge in the Permian Basin when it is de-bottlenecked in 2019. And it is possible that Trump will negotiate an end to Iran’s sanctions in return for additional promises by Iran.
With prices predicted by the model to fall into the low $40s in the second half of 2019, the futures market may very well drop sooner in anticipation. The market may become highly vulnerable to such a drop in January when global stocks are building quickly.
Check back to see my next post!
Best,
Robert Boslego
INO.com Contributor - Energies
Disclosure: This contributor does not own any stocks mentioned in this article. This article is the opinion of the contributor themselves. The above is a matter of opinion provided for general information purposes only and is not intended as investment advice. This contributor is not receiving compensation (other than from INO.com) for their opinion.

Hello,
I would like to learn how to trade oil options. Can you pls assist me or direct me to someone who could give some tutorials.
thanks,
Manny
Hi Manny,
We do not cover that aspect of the market, but here are a couple of educational links that can help you understand futures options.
https://www.investopedia.com/articles/active-trading/052214/trading-options-futures-contracts.asp
https://www.investopedia.com/trading/introduction-options-futures/
Best,
Jeremy
good
What the hell does that mean?