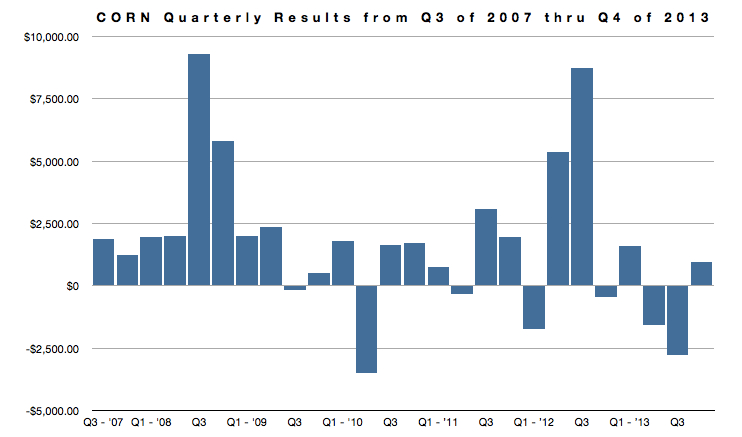
Corn has been a consistent performer in the World Cup Portfolio. Out of the last 27 quarters, corn has made money in 19 of them. The largest quarterly gain in corn was $9,287.50. The amount of margin allocated to trade corn was $8333.33. Corn has had only one losing year using the Trade Triangle Technology in the World Cup Portfolio.
| Year | Gain/Loss |
|---|---|
| 2007 | $3,125 |
| 2008 | $19,037.00 |
| 2009 | $4,706.75 |
| 2010 | $1,650 |
| 2011 | $5,487.50 |
| 2012 | $11,915 |
| 2013 | -$1,762.50 |
| TOTAL | $44,158.75 |
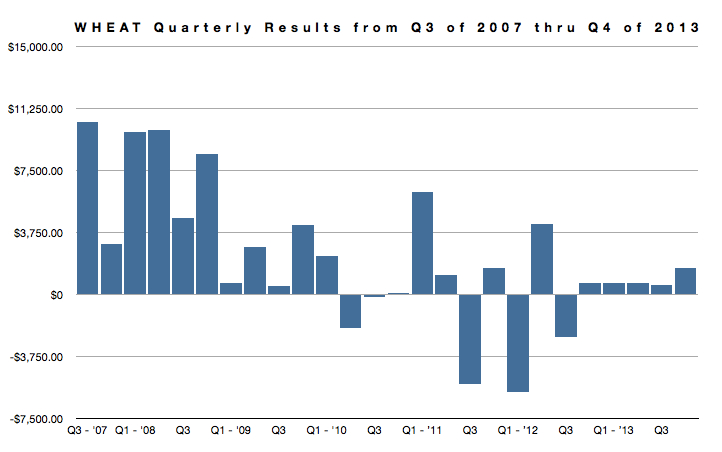
Like corn, wheat has been a consistent performer in the World Cup Portfolio. Out of the last 27 quarters, wheat has made money in 22 of them. The largest quarterly gain in wheat was $10,450.00. The amount of margin allocated to trade wheat was $8,333.33. Wheat has had only one losing year in the World Cup Portfolio in 2012.
| Year | Gain/Loss |
|---|---|
| 2007 | $13,525.00 |
| 2008 | $32,925.00 |
| 2009 | $8,275.00 |
| 2010 | $202.50 |
| 2011 | $3,562.50 |
| 2012 | -$3,550 |
| 2013 | $3,512.50 |
| TOTAL | $58,452.50 |
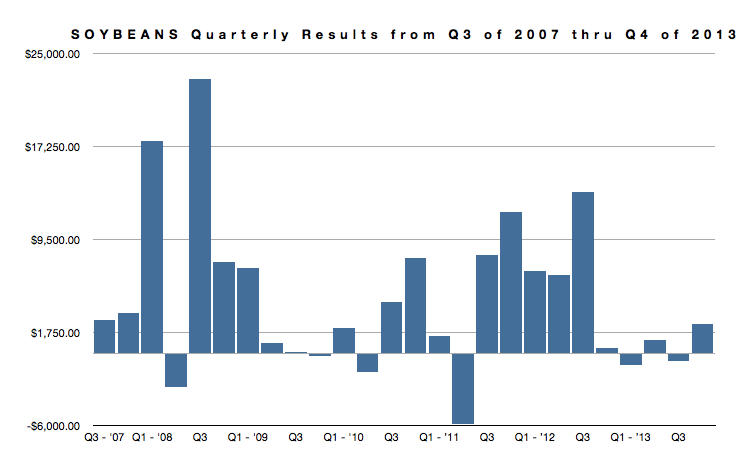
Soybeans have been a star performer in the World Cup Portfolio, racking up impressive gains of $117,081.25. Out of the last 27 quarters, soybeans have made money in 21 of them. The largest quarterly gain in soybeans was $22,900.00 in the third quarter of 2008. The amount of margin allocated to trade soybeans was $8,333.33. Soybeans have never had a losing year in the World Cup Portfolio.
| Year | Gain/Loss |
|---|---|
| 2007 | $6,125.00 |
| 2008 | $45,387.50 |
| 2009 | $7,893.75 |
| 2010 | $12,900.00 |
| 2011 | $15,575.00 |
| 2012 | $27,300.00 |
| 2013 | $1,900.00 |
| TOTAL | $117,081.25 |
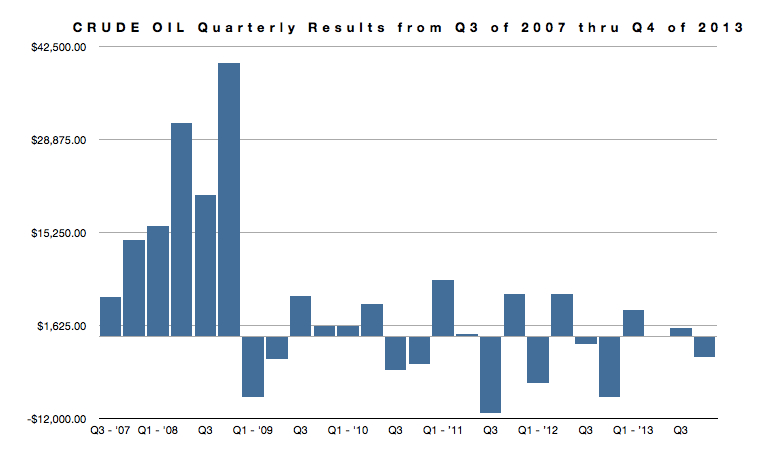
Crude Oil is a perfect non-correlating asset to the World Cup Portfolio. During 2007 and 2008, crude oil racked up gains of $128,490.00 in just 2 years. Out of the last 27 quarters, crude oil has made money in 18 of them. The largest quarterly gain in crude oil was $40,040.00in the fourth quarter of 2008. The amount of margin allocated to trade crude oil is $8,333.33. Crude oil has experienced 3 losing years in the World Cup Portfolio.
| Year | Gain/Loss |
|---|---|
| 2007 | $20,070.00 |
| 2008 | $108,420.00 |
| 2009 | -$4,730.00 |
| 2010 | -$2,680.00 |
| 2011 | $3,770.00 |
| 2012 | -$10,460.00 |
| 2013 | $2,260.00 |
| TOTAL | $116,650.00 |
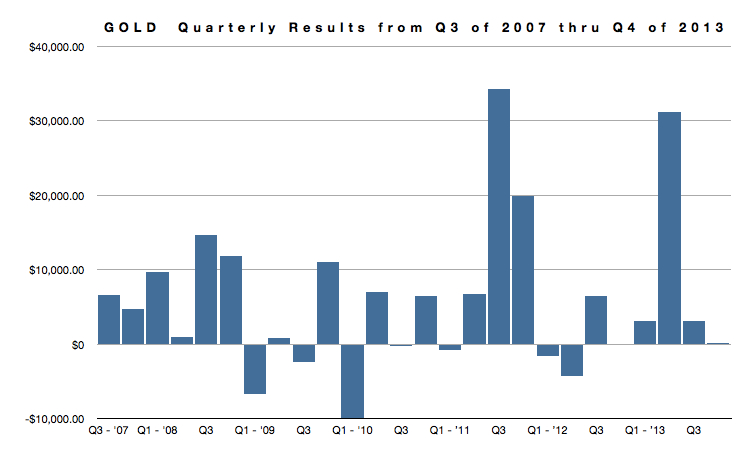
Gold is another star performer in the World Cup Portfolio, producing the most profit ($152,480) in the last 27 quarters. During Q3 of 2011 and again in Q2 of 2013, gold produced gains over $31,000 in both of those time periods. Out of the last 27 quarters, gold has produced a profit in 19 of them. The largest quarterly gain in gold was $34,273.00 in the third quarter of 2011. The amount of margin allocated to trade gold was $8,333.33. Gold has never had a losing year in the World Cup Portfolio.
| Year | Gain/Loss |
|---|---|
| 2007 | $11,236.00 |
| 2008 | $37,111.00 |
| 2009 | $2,650.00 |
| 2010 | $3,288.00 |
| 2011 | $60,095.00 |
| 2012 | $538.00 |
| 2013 | $37,562.00 |
| TOTAL | $152,480.00 |
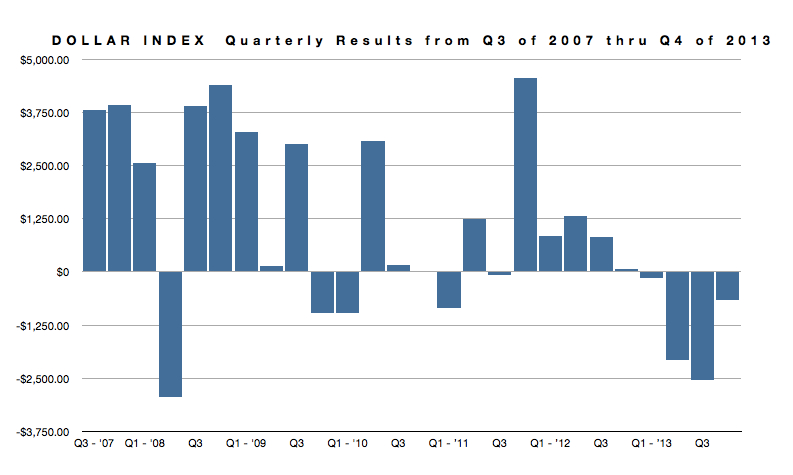
The Dollar Index is at the bottom of the returns barrel, producing a gain of $25,952.20 in the last 27 quarters. The Dollar Index is a perfect non-correlating asset in the World Cup Portfolio. Out of the last 27 quarters, the Dollar Index has produced a profit in 18 of them. The largest quarterly gain in the Dollar Index was $4,550.00 in the fourth quarter of 2011. The amount of margin allocated to trade the Dollar Index is $8,333.33. The Dollar Index has had just one losing year in 2013.
| Year | Gain/Loss |
|---|---|
| 2007 | $7,752.00 |
| 2008 | $7,930.00 |
| 2009 | $5,470.00 |
| 2010 | $2,308.20 |
| 2011 | $4,883.00 |
| 2012 | $3,050.00 |
| 2013 | -$5,441.00 |
| TOTAL | $25,952.20 |

