Last September, the Congressional Research Service published an "In Focus" report. They had already attempted to address speculation about the dollar's dominance in the face of global economic and geopolitical changes at the time.
Three major threats were addressed in that document.
China and its currency have risen to sixth place, accounting for 1.66% of global payments.
The next source of concern was US financial sanctions, as the share of Russian exports to Brazil, China, India, and South Africa in US dollars fell from 85% in Q2 2018 to 36% in Q4 2021.
Digital currencies, which include cryptocurrencies and digital currencies issued by central banks, have completed the list.
“Some policymakers have expressed concerns about an international race to create a digital currency with widespread adoption, arguing that the United States should create a U.S. digital currency to maintain the dollar’s prominence in international payments.”
"To date, there is no evidence of a shift away from the US dollar as the dominant reserve currency," the study concluded.
Back in October, I shared my most recent update for the dollar index, as it hit the first target with a fresh outlook.
At the time, I proposed two paths for the dollar: a continuation to the next target of $121 on an aggressively hawkish Fed, or a consolidation before resuming to the upside. The majority of readers supported both paths, with the consolidation option coming out on top.
The question of the dollar's dominance is resurfacing these days, as its value has plummeted dramatically. It is too early to tell whether this is a consolidation or a global reversal.
One thing is certain: the path of unending growth has been abandoned.
In my charts, I see a clash of perspectives. The technical chart is about to give a strong bearish signal. The chart comparing fundamental factors, on the other hand, supports the king currency's continued strength.
Let me show you each of them one by one, beginning with the emerging bearish alert.
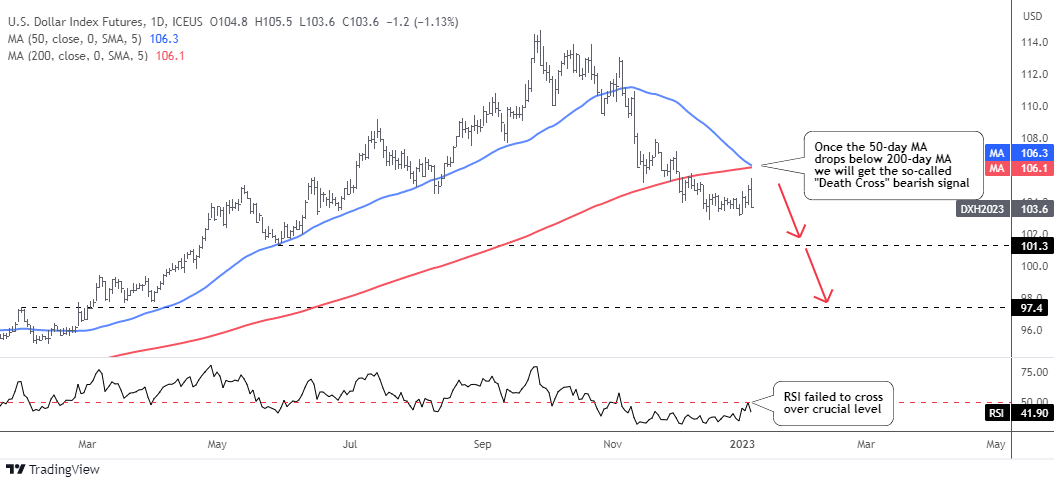
In the dollar index daily chart above, there are two simple moving averages. The blue line represents the 50-day moving average, while the red line represents the 200-day moving average.
We can see that the short-term blue line very closely approached the long-term red line from above last week. When it falls below the latter, a bearish pattern known as a "Death Cross" will form. It will indicate a downward shift in the trend.
Furthermore, the RSI indicator failed to cross above the critical 50 level when the December Bullish Divergence played out.
The first support could be near the $100 round number. The previous high of $97.4 established in January of last year is the next support.
Let us now compare the real interest rates of the dollar's major competitors.
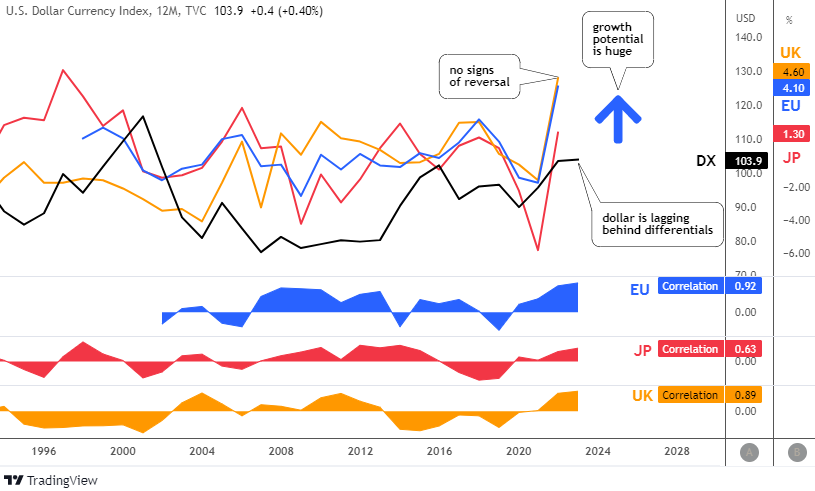
The yearly chart of the dollar index (black line) above is compared to the real interest differentials of the major components of the US dollar index.
The real interest rate differentials are depicted on the scale B with the blue line for the United States and the Eurozone, orange line for the United States and the United Kingdom, and red line for the United States and Japan.
This time I added the correlation ratios with interest rate differentials in the same colors.
Currently, the strongest correlation of the dollar index is with the real interest rate differential between the United States and the Eurozone (blue), which is close to absolute at 0.92.
The second highest reading is 0.89 for the US-UK (orange), and the lowest but still positive correlation is 0.63 for Japan.
All of the correlation ratios are at their highest points.
All differentials are rising and at higher levels than in October, which should help the dollar. For the first time since 2019, Japan's reading has risen above zero. The dollar index is lagging far behind E.U. and U.K. readings, which point to the $130 area. The dollar's accumulated growth potential is enormous.
We can use the time period between 1995 and 2001 as a sample for the reversal signal. The UK differential began to fall in 1995, Japan's differential in 1997, and the Eurozone differential in 1999.
Despite this, the dollar index rose until 2001, when it peaked and reversed to the downside. If this sample is applied to the current situation, the dollar index may rise in 2023-2024, even if differentials have already peaked.
Intelligent trades!
Aibek Burabayev
INO.com Contributor
Disclosure: This contributor has no positions in any stocks mentioned in this article. This article is the opinion of the contributor themselves. The above is a matter of opinion provided for general information purposes only and is not intended as investment advice. This contributor is not receiving compensation (other than from INO.com) for their opinion.


Countries and reserve banks are buying gold in monumental numbers and the "Federal" Reserve's attempts to manipulate it and getting investors to believe their lies are failing so the USD will give way to gold as the better safe haven.
Dear Bruster, thank you for sharing your thoughts.
Three of my earlier posts support your opinion.
There were two that dated back to 2015.
1. "Can Central Banks See What We Don't?" (November 2022)
https://www.ino.com/blog/2022/11/can-central-banks-see-what-we-dont/
2. "Winter Is Coming"… Hungry For Gold" (December 2015)
https://www.ino.com/blog/2015/12/winter-is-coming-hungry-for-gold/
3. "Enter The Dragon" Starring … Gold" (December 2015)
https://www.ino.com/blog/2015/12/enter-the-dragon-starring-gold/
Wishing you a happy and prosperous new year!
Aibek
Dear Frank, thanks for stopping by,
You provide me with regular feedback and I really appreciate it.
I see what you are up to, let us wait and see.
Currently, there are no alerts in the dollar's turnover statistics.
However, any so-called "Black Swan" could change everything at any time.
My best wishes to you, Aibek
I voted bullish on the dollar, but not because I am bullish long term; Short term I expect it to bounce up, possibly double top then adios