
The year is approaching a sunset. It is the right time for precious metals to get ready for a Santa Claus visit to take them for a ride to the sky. One of the metals has already been in the game; I am talking about gold.
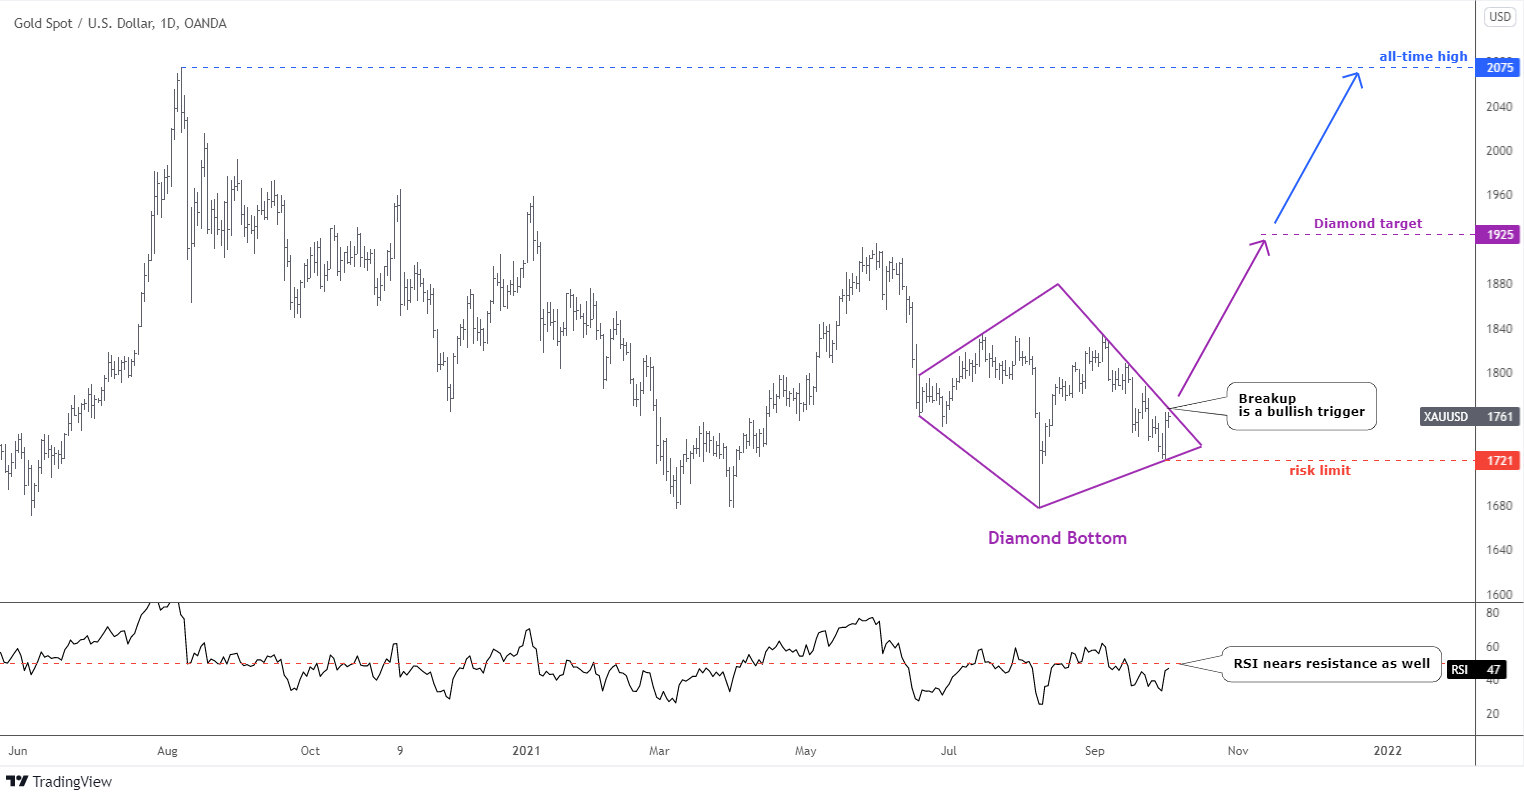
In October, I enriched the bullish view with the newly spotted “Diamond” reversal pattern. Most of you confirmed that you see this pattern. It is still good, as the invalidation level was not touched.
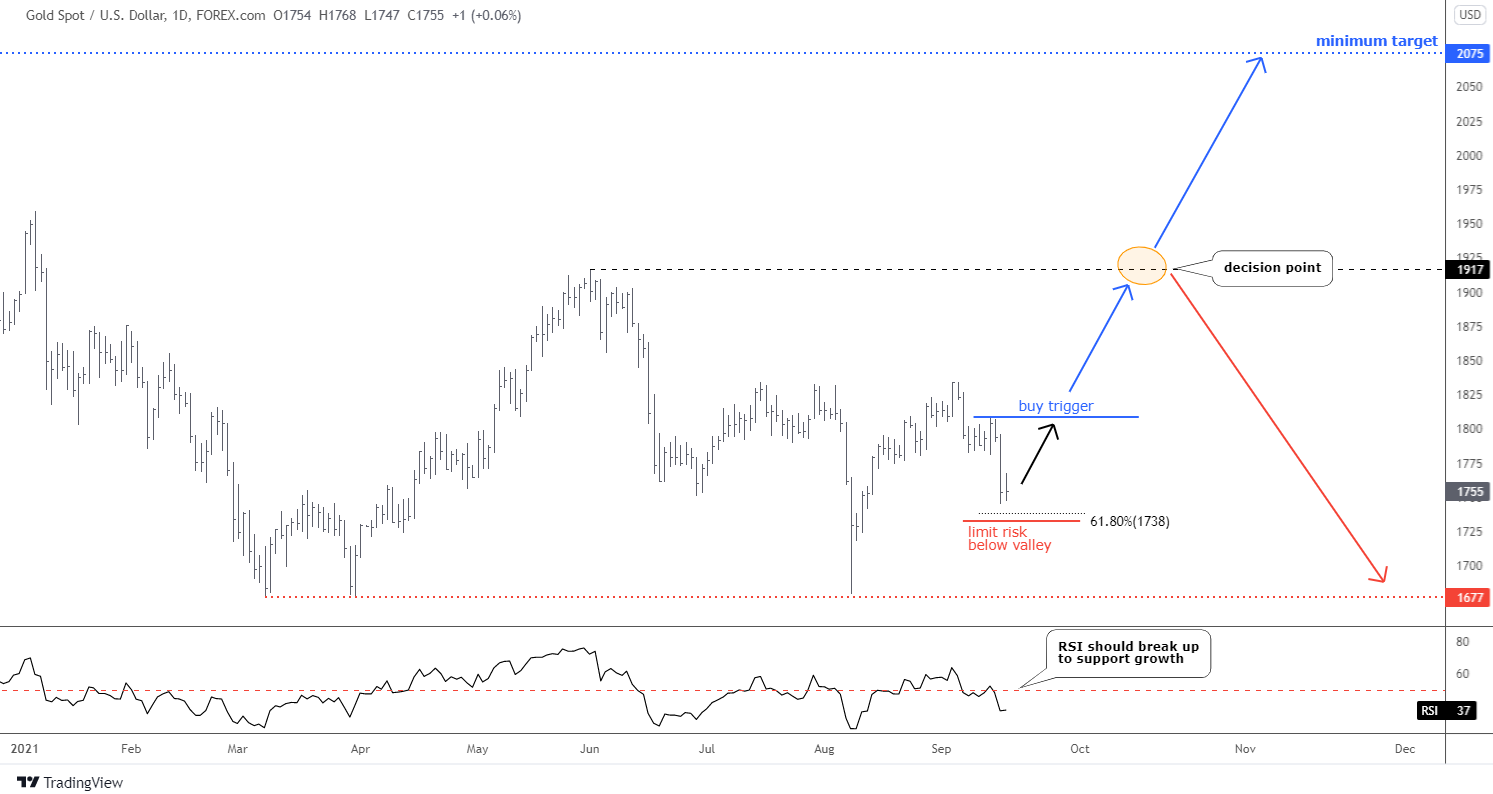
Before that, in late September I shared with you this setup above and asked your opinion whether the long-lasting consolidation was over. The majority of readers chose the “Yes” option, and we see more and more evidence that this bet could pay well.
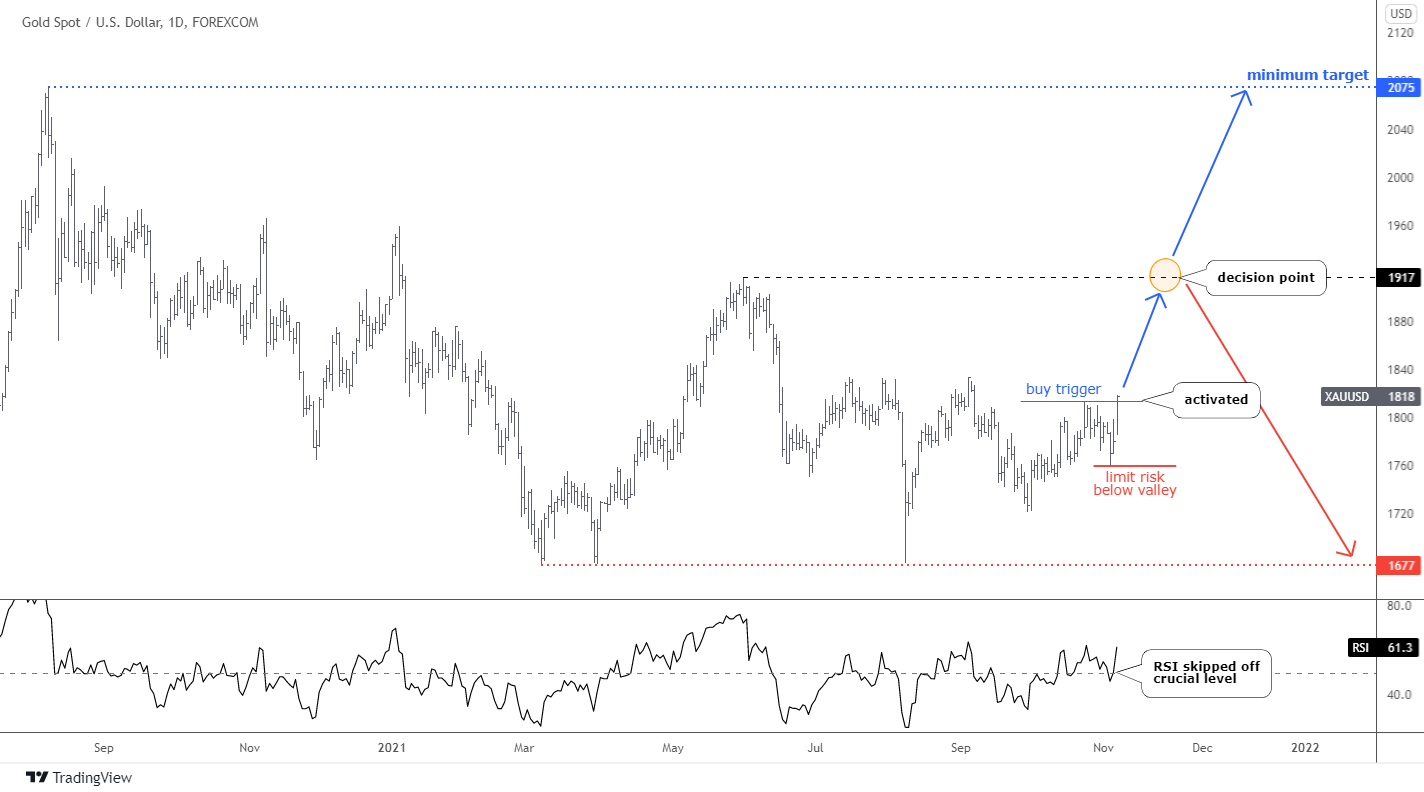
In the updated chart above, I moved the buy trigger to the most recent top at $1,814 from the top of the joint at $1,809. The former is more reliable as we have a setback that did not break below the earlier bottom and the subsequent reversal to the upside. Anyway, both of them were activated last Friday as the price closed above triggers at $1,818.
The RSI indicator skipped off the crucial 50 level and reversed to the upside, supporting the breakup on the price chart.
Traders should consider limiting the risk below the most recent valley of $1,759 established last Wednesday. The minimum target is located at the all-time high of $2,075. The risk/reward ratio streams to 5.
As I warned before, we should watch the decision point at $1,917 about the possible extension of a large consolidation in that area. The gain/pain ratio there falls to 1.9, which is still positive.
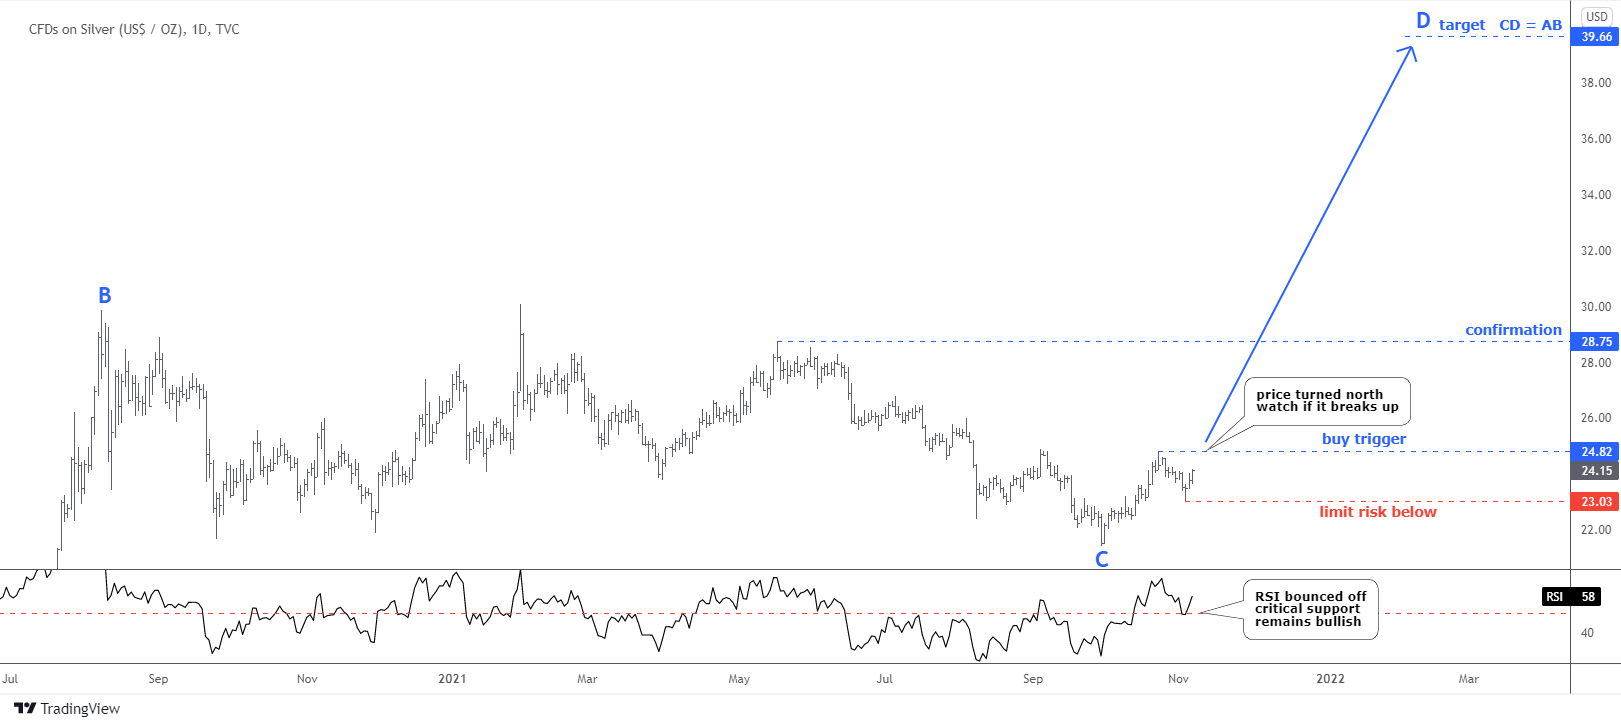
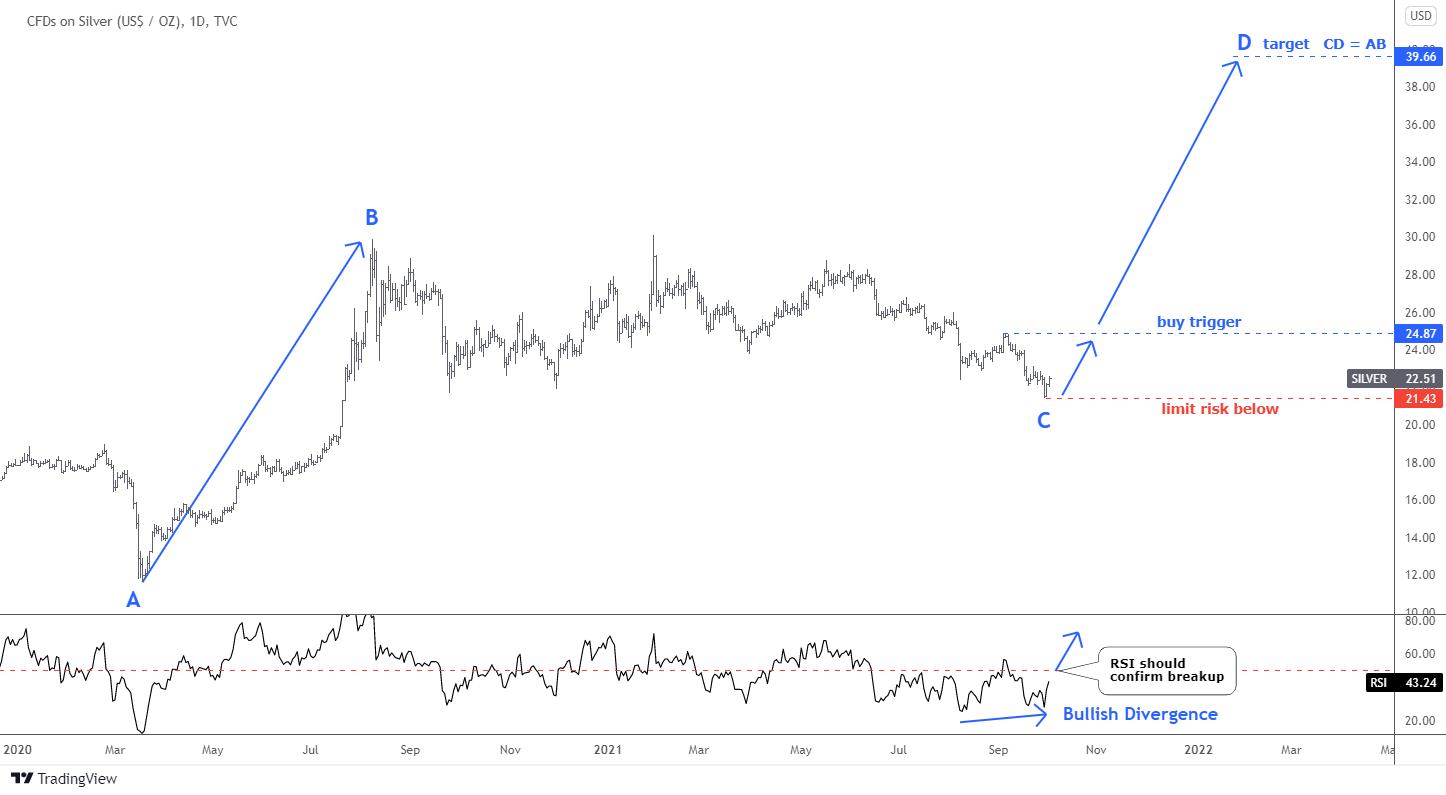
Silver falls at least one step behind gold as it has only one higher valley compared to two higher lows in the gold chart. But, on top of it, the buy trigger remains untouched.
The RSI at least has shown a neat action as it bounced off the critical support perfectly.
The price of silver retraced almost 50% from the recent top and reversed to the upside. I moved the buy trigger from the invalidation level of $24.87, which was set in the earlier update to the above-mentioned top of $24.82. They are both located in the same area. However, I prefer the setup based on a setback for a good reason explained under the gold chart. We are less than one dollar away from the bullish trigger.
The target level remains unchanged at $39.66, offering a jaw-dropping risk/reward ratio of 8.3. The price needs to book a hefty 60% gain after a breakout to hit the target. Therefore, one should consider cutting the risk below the most recent valley of $23.
We could consider the breakout above the top of the joint between large legs 1 and 2 down at $28.75 as the confirmation for this bullish setup.
Intelligent trades!
Aibek Burabayev
INO.com Contributor, Metals
Disclosure: This contributor has no positions in any stocks mentioned in this article. This article is the opinion of the contributor themselves. The above is a matter of opinion provided for general information purposes only and is not intended as investment advice. This contributor is not receiving compensation (other than from INO.com) for their opinion.