This week we have a stock market forecast for the week of 4/04/21 from our friend Bo Yoder of the Market Forecasting Academy. Be sure to leave a comment and let us know what you think!
The S&P 500 (SPY)
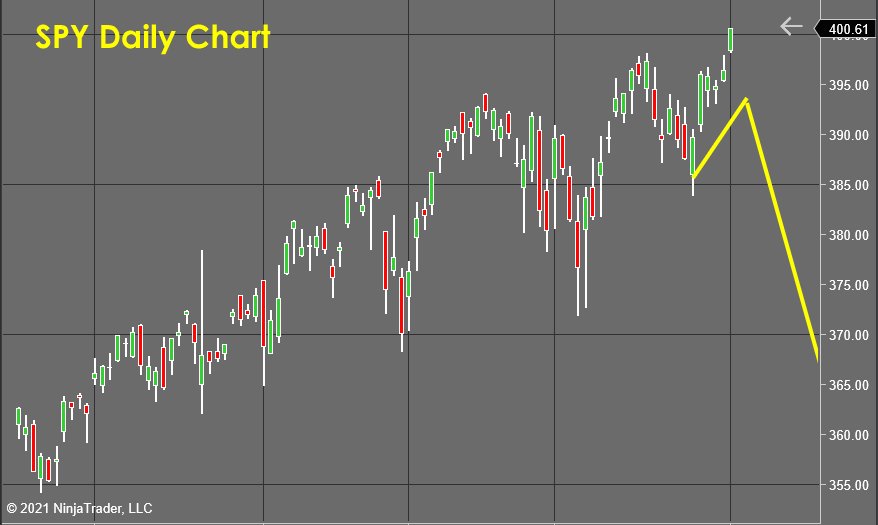
The news of the new infrastructure/stimulus bill caused the market (analyzed here using the SPY) to react with a gap up and run type candlestick. This surge took out the highs since it seems the Fed will accept a period of inflation as all these new print and spend policies work their way through the economy. The Jobs numbers beat expectations as well, and this also pushed stocks higher. However, the buying hasn’t shown to be connected to a new surge in internal bullish energy, so I’m still expecting to see a topping process begin soon.
With this new upthrust in prices, the head and shoulder pattern I was forecasting for this week has invalidated itself, and I’ll wait to see what profit-taking pressures show up next week before figuring out if this breakout is just simply the head of a NEW head and shoulders formation.
The good news is that my forecasting tools allow me to measure the supply/demand forces in real-time... The bad news is that they ONLY measure the INTERNAL market forces. The Fed and other outside policy forces are not measurable. Therefore they can “reset” my tools, which forces me to the sidelines until the stimulus settles, and I can be confident I am measuring true organic market internals.
As we drift towards a more centrally managed economy, this means there is a veil of government-induced “noise,” which can be most frustrating as forecasts get “ruined” by bursts of buying coming from outside the normal avenues of demand.
Coca-Cola (KO)
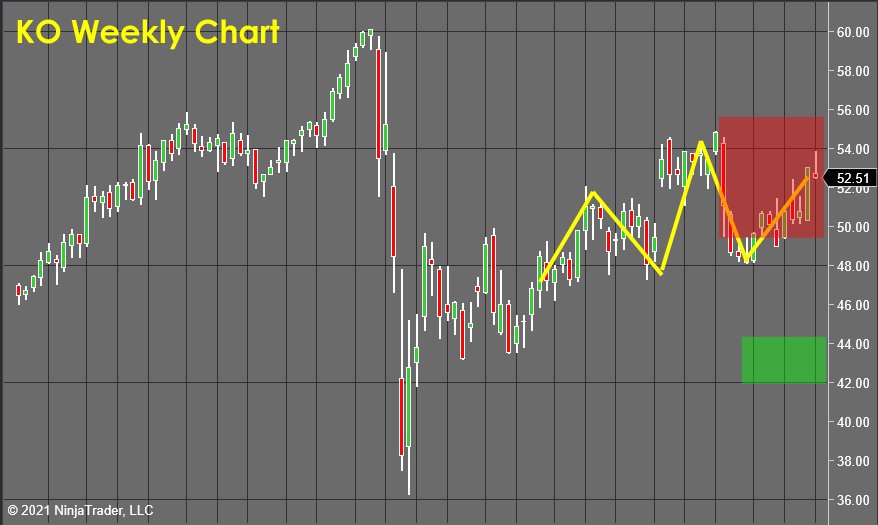
Coca-Cola (KO) rolled over this week within the red zone, and this reversal candlestick offers the bears another pivot point around which to attract a new wave of selling.
The deep timeframe cycles are still confirming this as a significant top, but there is a bit of smaller timeframe bullish energy to be dissipated. This tug of war means that we might see one last bullish push back up to retest the $54 per share area before things confirm and turn lower.
As the stock continues to trade within the Red Zone, I still consider it a short opportunity as long as it doesn’t take out the highs near $55. If that were to happen, it would be considered a stop-out.
Gold (GLD)
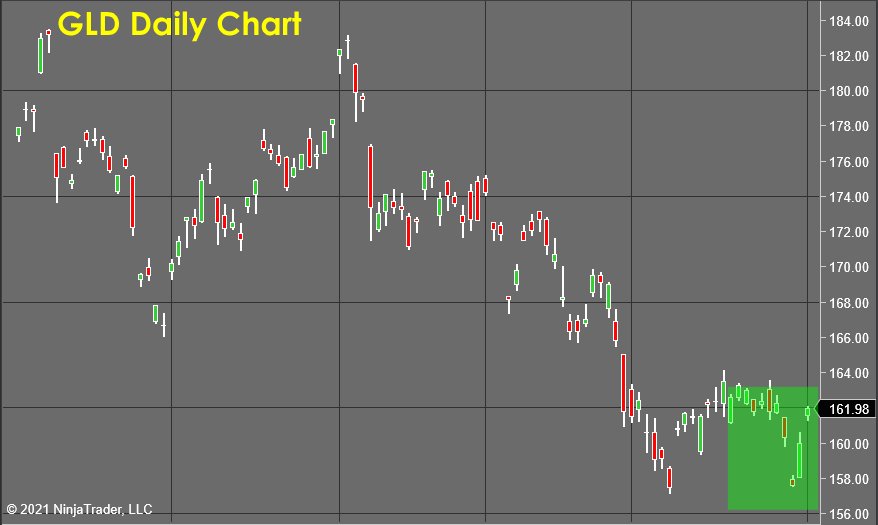
Gold (analyzed here using the ETF GLD) confirmed its bottom nicely and launched higher to close out the week nicely! As with any long forecast you see me publish, I consider any price within the Green Zone as “a buy,” with a stop-loss set under the lows of that green zone near $156.
I still very much believe this is a significant bottom for gold, so I don’t have a specific profit target set for this trade yet. Once the bottoming action we saw this week gathers in the attention of the momentum crowd and gets things rolling higher... I’ll be in a position to take a set of measurements and get a better sense for the odds and scope of the rally longer term.
Regeneron Pharmaceuticals (REGN)
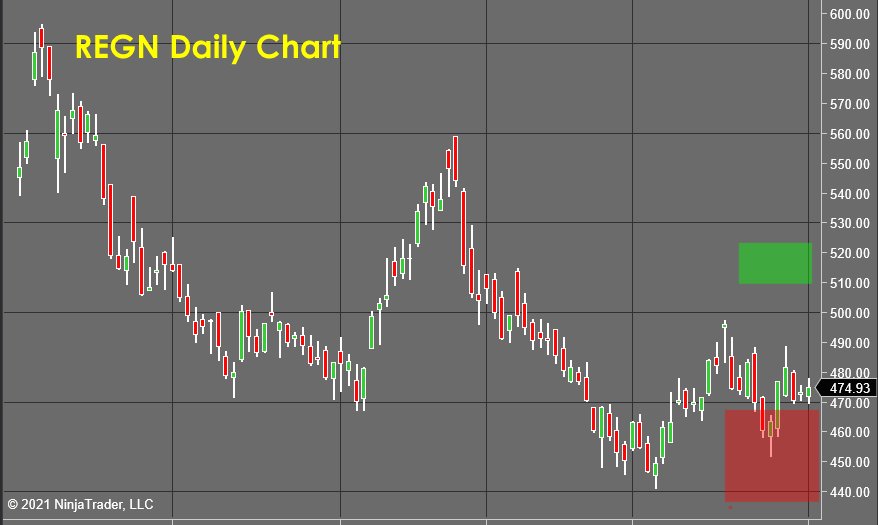
The stock of Regeneron Pharmaceuticals (REGN) is working out another higher low on the daily chart as we wait for the now confirmed bottom to attract more buying into this market.
There is not much to add to this forecast as little has changed from the action this week. This is a “sit tight and be right” moment, one of MANY you will experience as a trader.
It often is quite a shock to a new and aspiring trader who join our trading family at Market Forecasting Academy to learn how much of trading is either spent prospecting for new opportunities, waiting for those prospects to “ripen,” or waiting for your open positions to commit to a trend and either stop out for a loss or begin to march up to the profit targets.
This is the reason why trading requires such emotional maturity and discipline. It is so easy to say “STICK TO THE PLAN,” but it’s a lot harder to do that when you are bored out of your mind and crawling out of your skin to relieve the pressure of inaction.
To understand this basic human tendency, think back to the scene out of a horror movie we have all seen where an obvious victim thinks it would be a great idea to go down into a dark and dusty basement. The director usually strings things along with false scares and distractions as the tension builds to the point where it’s actually a relief when the monster attacks!
This is the mechanical reason why you will often see a stock that looked so promising just drift along sullenly for weeks at a time, then suddenly explode higher without warning.
What is happening is that the weaker traders who bought in reaction to the obvious bottom get bored and antsy and sell their positions for a tiny profit as the market hacks and chops. With the bad taste in their mouth of yet another “failed trade,” they watch to see how the stocks ends up. When it begins to rocket up, they react emotionally... “I KNEW IT WAS A BUY” and re-enter (usually at a terribly disadvantaged spot).
By making a plan and sticking to it, I am committing to my forecast. Unless there is specific and credible evidence of failure, I know I put myself into a position where the odds were firmly in my favor, and so it’s my job to do the hard thing... NOTHING(and let the math do the rest)!
Extra Space Storage (EXR)
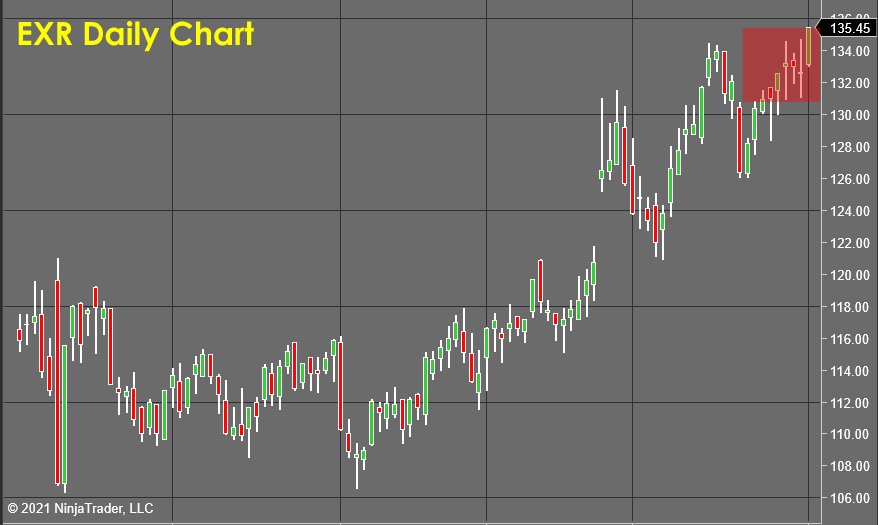
Extra Space Storage (EXR) is a new opportunity I found last week. The stock had been forming a “Head And Shoulders” reversal pattern on its daily chart, and I forecast that this would attract the attention of the technical trading community, which would turn price lower.
This opportunity was considered a valid short anyplace within the Red Zone IF a daily reversal candlestick can form. Two “Doji” candlesticks did indeed form, and then the price rallied up to take out the recent highs near $135, which triggered stop losses on this trade.
To Learn How To Accurately and Consistently Forecast Market Prices Just Like Me, Using Market Vulnerability Analysis™, visit Market Forecasting Academy for the Free 5 Day Market Forecasting Primer.
Check back to see my next post!
Bo Yoder
Market Forecasting Academy
About Bo Yoder:
Beginning his full-time trading career in 1997, Bo is a professional trader, partner at Market Forecasting Academy, developer of The Myalolipsis Technique, two-time author, and consultant to the financial industry on matters of market analysis and edge optimization.
Bo has been a featured speaker internationally for decades and has developed a reputation for trading live in front of an audience as a real-time example of what it is like to trade for a living.
In addition to his two books for McGraw-Hill, Mastering Futures Trading and Optimize Your Trading Edge (translated into German and Japanese), Bo has written articles published in top publications such as TheStreet.com, Technical Analysis of Stocks & Commodities, Trader’s, Active Trader Magazine and Forbes to name a few.
Bo currently spends his time with his wife and son in the great state of Maine, where he trades, researches behavioral economics & neuropsychology, and is an enthusiastic sailboat racer.
He has an MBA from The Boston University School of Management.
Disclosure: This article is the opinion of the contributor themselves. The above is a matter of opinion provided for general information purposes only and is not intended as investment advice. This contributor is not receiving compensation for their opinion.

If Bo can tell us what the stock prices of aapl, msft, nvda will close at this Tuesday, I'll give more than a little credence to these stabs in the dark. Oh, and did I forget to mention bitcoin?
Arthur, clearly you are trolling but I'll pass that over to use this as a "teachable moment".
I scan through about 700 stocks each week to find the highest probability opportunities each week, and you can think of these potential trades like hands in poker. Each will have a probability for success or failure, which I can measure using my market forecasting tools. Just like a poker hand, these "setups" will see their odds expand or contract as they move forward. Each week I take a new snapshot look at the supply and demand balance and like a poker player, decide if I want to "check, bet or fold" that position.
Since I'm looking to skim the cream for you each week, I'm passing on a TON of lower probability forecasts.
AAPL for example is in the middle of a move this week. Bullish internal energy is expanding along with price, so I can confirm that it's moving higher and not a great short, but there isn't any "hidden" knowledge that my proprietary indicators are offering. Without hidden info that only I have which the rest of the market lacks, there isn't any edge for me, so it's not a stock that I am interested in at the moment.