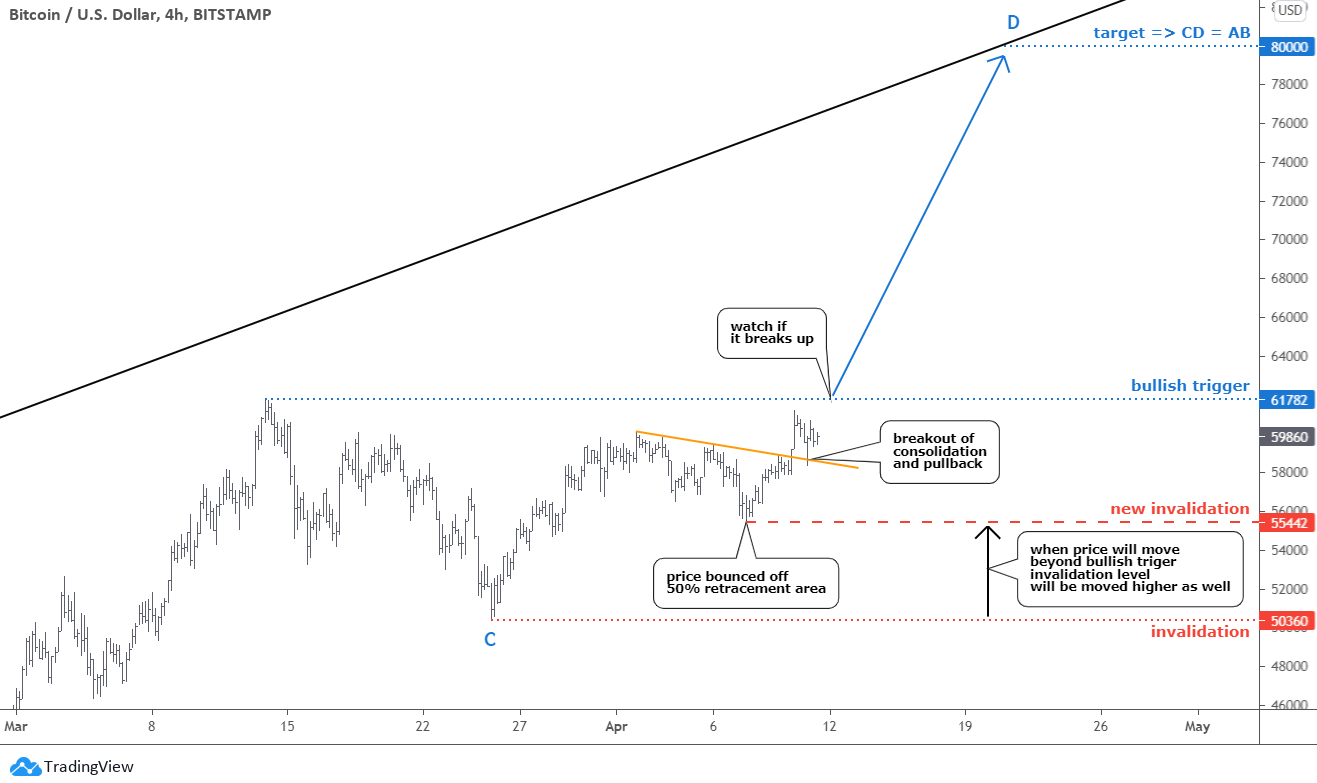
A sleepless Bitcoin moves accurately as per the plan posted last week. The majority of you agreed that the $80k target is achievable for the leading coin. Here is an updated chart below where I zoomed in to a 4-hour time frame to share more details with you.
As I said before, Bitcoin's chart structure builds similarly with conventional trading instruments these days. The forecasted correction reached the 50% Fibonacci retracement level in the $55k area. It stopped there as the price bounced up and hit the orange trendline resistance soon.
That obstacle was tangible, as the price could not overcome it at once. Only after a tiny consolidation Bitcoin managed to break out. The classic price action took place then as the main coin has recently built a small pullback to the broken resistance.
Crypto Expert Says Forget Bitcoin and Buy These Instead
There's no doubt that the cryptocurrency space has seen astronomical growth over the last few months. And with multinational corporate backing pouring in, cryptos are here to stay. The only trick is knowing where to invest.
The next barrier is within reach now as the price has been just $500 away on the breakout. It is a bullish trigger, and I think it is a matter of a few days before Bitcoin cracks it. Once it is done, it will be better to move the stop higher if you are in the trade to cut the risk. The new invalidation will be below the valley of the earlier minor consolidation at $55k. The risk/reward will increase to 2.7 then from the current 1.6.
Apple Inc. (AAPL) has built a magic ecosystem that penetrates many spheres of our everyday lives. Recently, they have revealed a plan to enrich their universe with car production, and it will not be simple cars but autonomous.
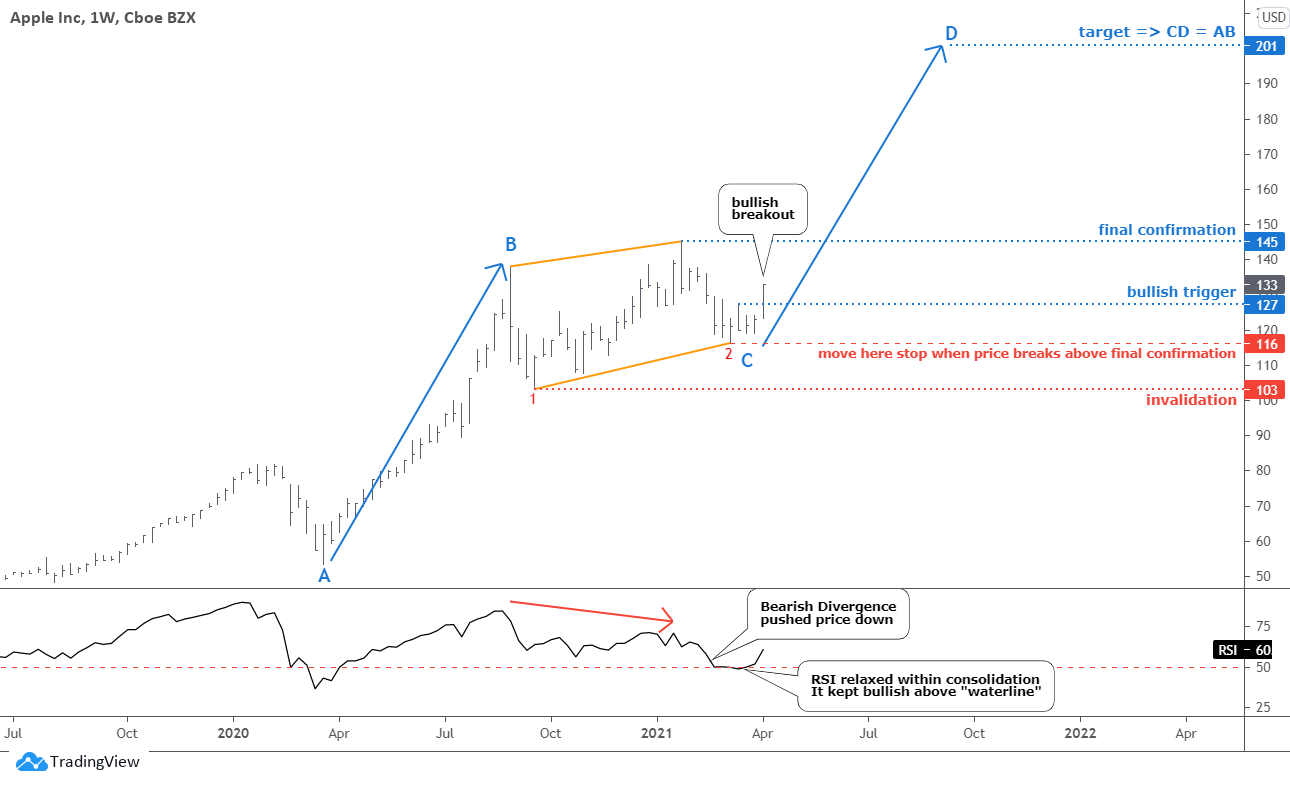
The price of Apple Inc. (AAPL) has fallen since the end of January within a large sideways consolidation (orange trendlines). It consists of two big legs down (red). You can see on the RSI sub-chart that the Bearish Divergence played out here after the price established a new high, but the RSI failed to initiate the current leg down.
This corrective structure retraced the preceding huge bullish move marked as a blue AB segment for 38.2%. It could be enough to attract more buyers for another rally. The price already broke above the previous top of $127 set as a bullish trigger. That move was of a rocket style as we can see that the recent weekly bar closed on the maximum last Friday.
The current CD segment's target is located at $201, where it would travel an equal distance of the AB part. The potential gain is 50%. The risk should be limited once the price breaks below the first leg's valley at $103. The current risk/reward ratio stands at 2.3, which is reasonable. When the price moves beyond the all-time high of $145, it will be good to cut the risk to a higher price level of the recent valley at $116. The risk/reward ratio will increase to 4.1 then.
Let's look at the RSI again, and it is showing very accurate dynamics as it has relaxed within the recent consolidation. Still, it managed to keep bullish above the "waterline" despite the selling pressure. Now it raises its head towards the topside, supporting the recent breakout.
Intelligent trades!
Aibek Burabayev
INO.com Contributor, Metals
Disclosure: This contributor has no positions in any stocks mentioned in this article. This article is the opinion of the contributor themselves. The above is a matter of opinion provided for general information purposes only and is not intended as investment advice. This contributor is not receiving compensation (other than from INO.com) for their opinion.


