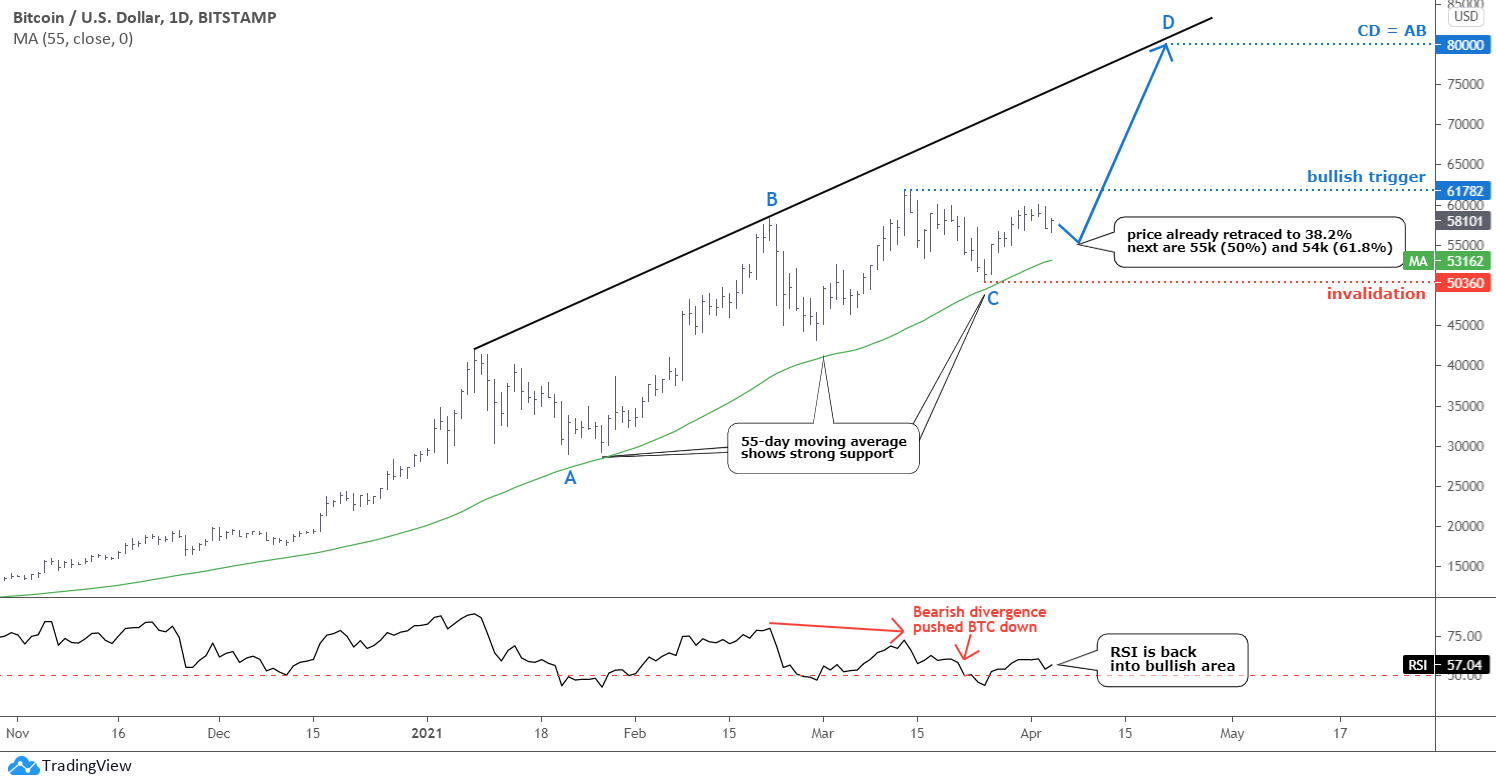
As Bitcoin matures, the chart structure becomes more readable over time. We can see how such a conventional indicator as a moving average perfectly supports the price. I added a 55-day (Fibonacci number) moving average (green), which at least three times this year kept the price in the bullish mode that started last October when the price crossed this line to the upside.
Another popular indicator RSI has perfectly detected the Bearish Divergence and pushed the price down last month. After that, it moved back above the crucial 50 level, which supported the current upward move.
I see possible AB/CD segments in the chart (blue labels). The BC consolidation was huge and complicated, but it could be over now. If the CD segment travels the same distance as the AB part, then the price of Bitcoin could hit the new all-time high of $80,000. The projection of the black trendline resistance confirms that ambitious target, and we know how powerful the trends are.
On the lower time frame, the price is consolidating after the bullish move as it already reached the 38.2% Fibonacci retracement level. The 50% and 61.8% levels are located lower at 55k and 54k, respectively. After that, Bitcoin could rocket to the target. The bullish confirmation level is located at the current all-time high of $61,782. The invalidation trigger is located below the C point of $50k.
This scenario goes in line with my statistical calculations shared with you in February with the title "Can You Imagine Bitcoin At $103,000?". The majority of you agreed with the math behind this unbelievable target.
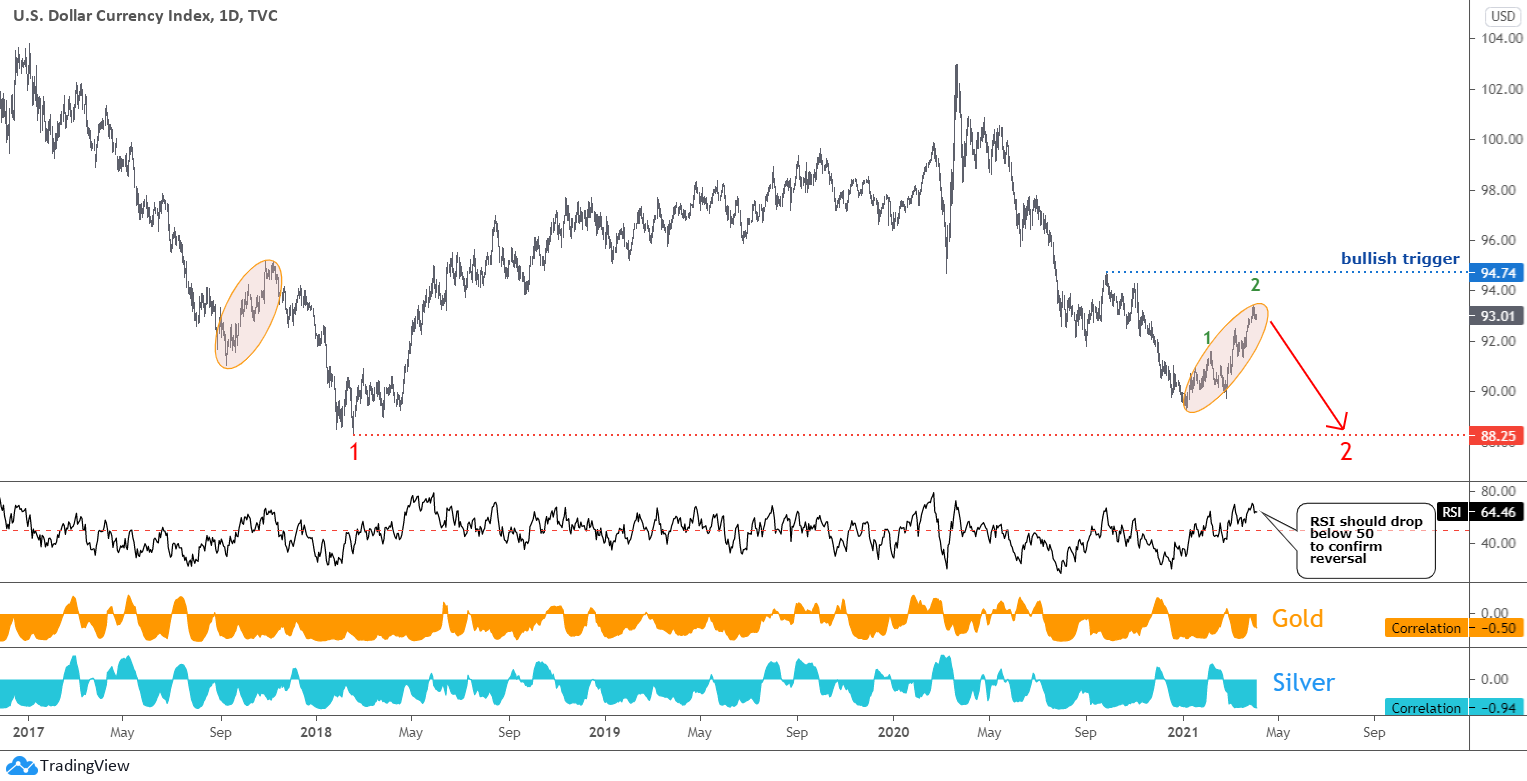
The dollar index continued higher despite my latest bearish call as it moved instead per my earlier plan of another leg higher.
This correction (right orange ellipse) is large enough. It is visible on the squeezed daily chart; it is about the same size as a similar pullback in the large first leg down (left orange ellipse); the second leg of the current pullback traveled almost 1.618 of the first leg. It could be enough to move to the next step – continuation to the downside as we saw it in the first drop when the price hit the valley of 88.25. I am looking forward for the next move to retest that low.
The RSI should drop below 50 to confirm the reversal of DXY to the downside.
There is a slight chance that the dollar already reversed to the upside in a big move, so we should watch the bullish trigger of 94.74 closely.
Look at the correlation sub-charts; silver is more inversely correlated than gold these days.
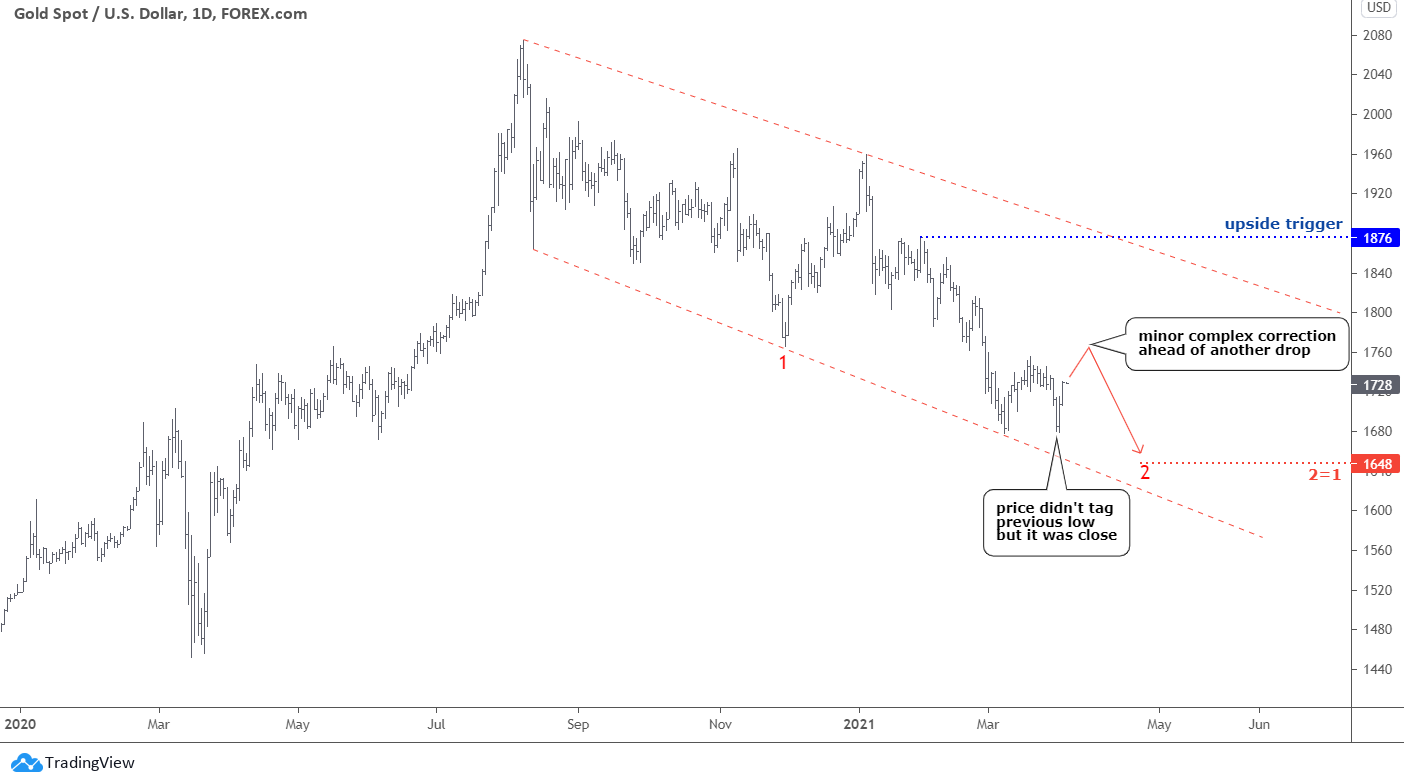
Gold was just one dollar away last week to tag the previous low, but it failed. A strong bounce-up has followed, and it could be just a second leg of the minor complex correction ahead of another drop.
I relabeled the large legs down as the current move down is close to traveling the same distance as the first one. It should hit $1648 to complete the move of the equal distance.
The upside trigger is far above at $1876. Let us see if this current move could build something bigger to change the structure to the bullish mode when it reaches the former top around $1760.
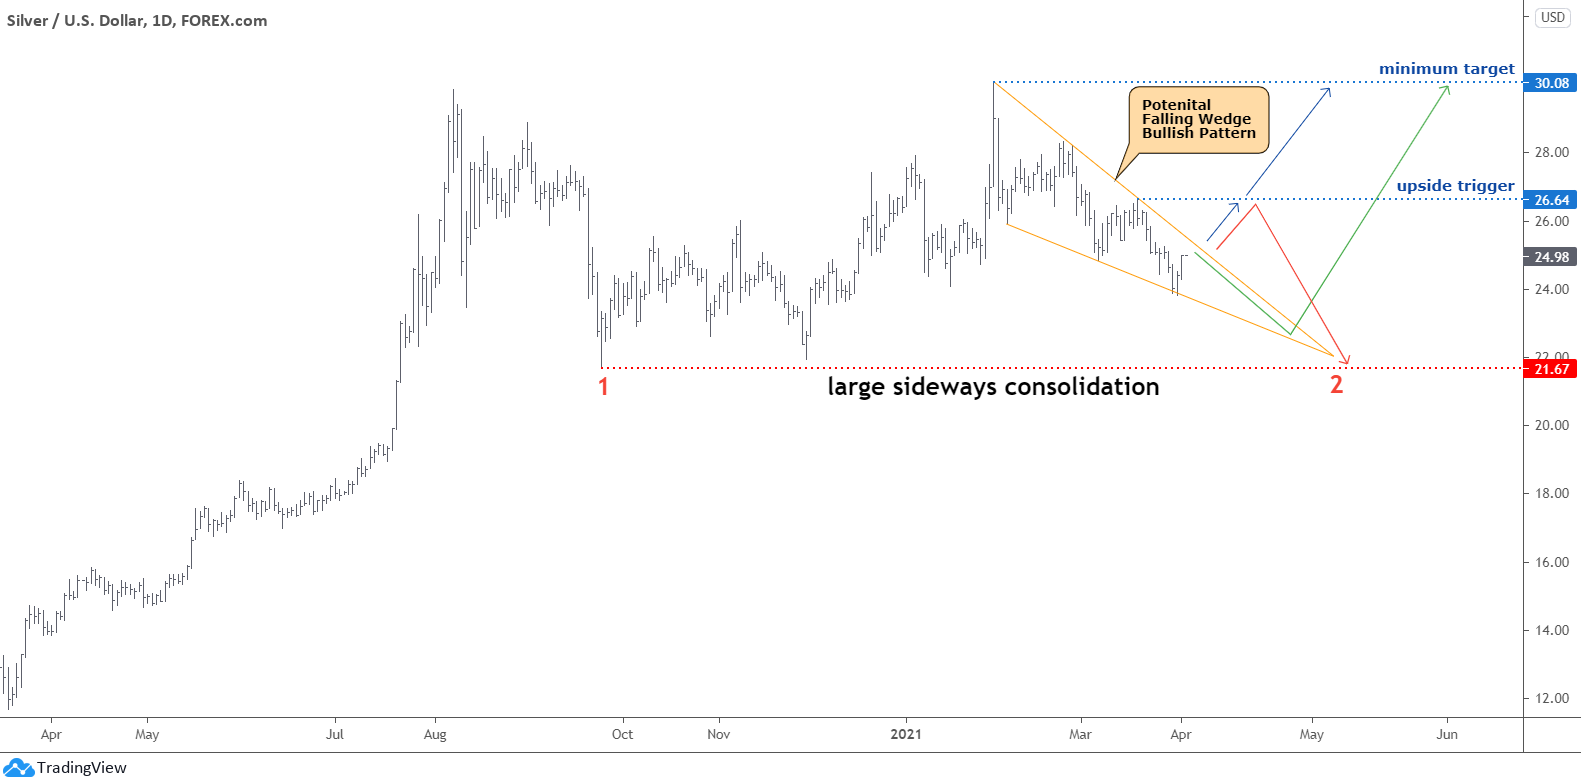
The converging orange trendlines shaped a perfect Falling Wedge Bullish pattern for silver. This has changed the second leg's structure down, as now it does not look like a more simple first leg down. In its turn, the entire structure of this large sideways consolidation could have changed. The retest of the former valley is not mandatory in this case. Three options could emerge.
The blue up arrows scenario means that the Falling Wedge pattern has been completed, and the current move up is the part of the large rally at least to the $30 area. I will update the projected target once the market establishes the actual growth point. The upside trigger is located at the former top beyond $26.64. The invalidation point is below the most recent low of $23.78.
The green path assumes another drop within the pattern before a reversal to the upside. The bullish confirmation will be above the current move's top if it fails.
The red plan considers the reversal around the former top and the subsequent retest of the first leg's low of $21.67 within the classic structure. It does not follow the Falling Wedge pattern. This scenario is similar to gold's outlook above.
Intelligent trades!
Aibek Burabayev
INO.com Contributor, Metals
Disclosure: This contributor has no positions in any stocks mentioned in this article. This article is the opinion of the contributor themselves. The above is a matter of opinion provided for general information purposes only and is not intended as investment advice. This contributor is not receiving compensation (other than from INO.com) for their opinion.


Bitcoin
There is no high that is too high for Bitcoin (over time)
There are only 21 million bitcoins that can be mined in total. ... As of February 24, 2021, 18.638 million bitcoins have been mined, which leaves 2.362 million yet to be introduced into circulation. Once all Bitcoin has been mined the miners will still be incentivized to process transactions with fees.
The 21 million cap ensures a scarcity premium that little else can match
Dear Mr.Ewin,
Thank you for sharing.
It sounds like a #hodl slogan indeed.
Best wishes to you, Aibek