Some investors believe that the price of Bitcoin could hit $100k. In this post, I'll share some measurements I made in the bitcoin chart to see if there is some evidence for such strong optimism.
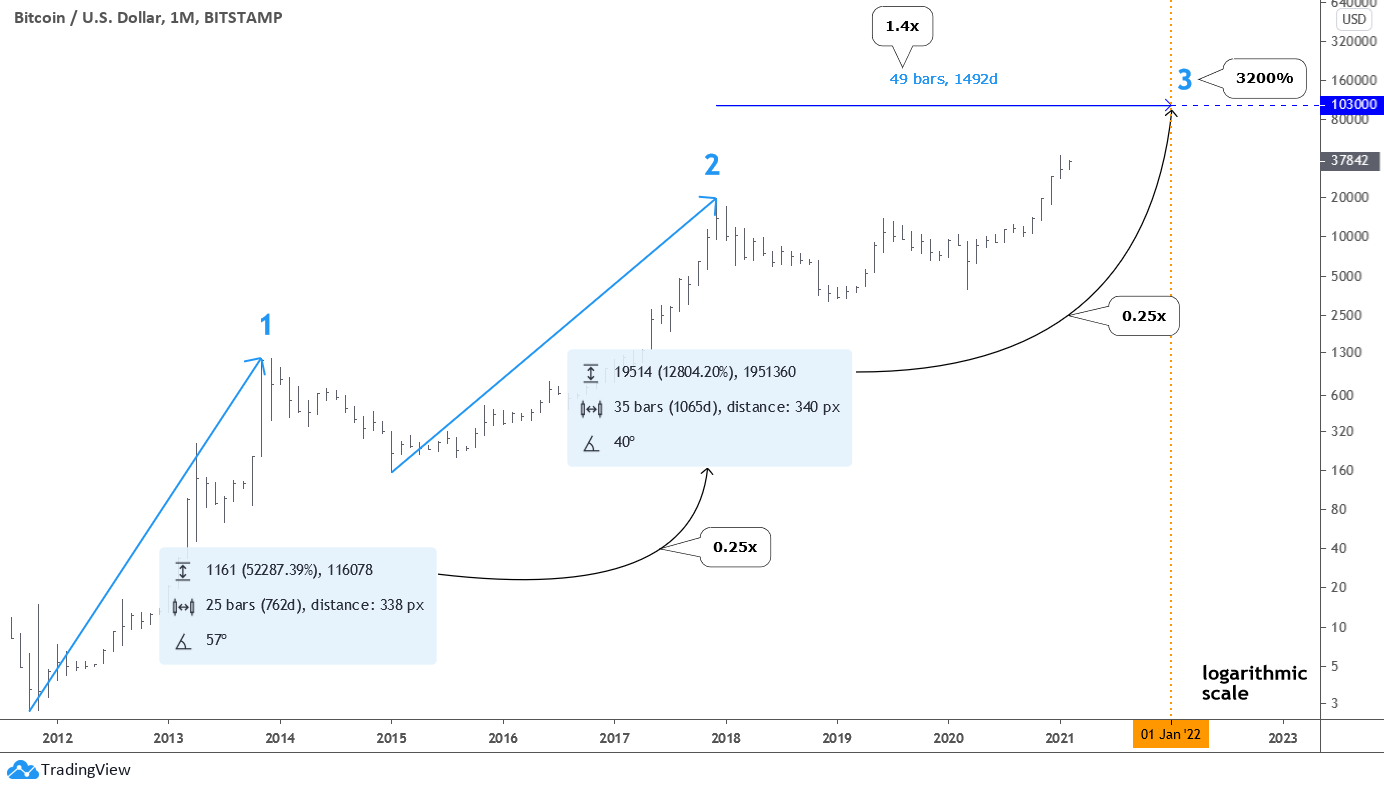
There is a logarithmic (log) monthly chart of bitcoin below. I chose the log scale to show you the coin's relative performance. It will reveal the different angle of view on the price dynamics for you.
We can highlight two completed large moves to the upside marked with numbers accordingly. On the right side of each move, there are light blue statistics windows showing how much, how long, and how sharp the move was.
Let's start with the percentage of the growth. The first move booked an unbelievable 52,287% when Bitcoin hit above the psychologically crucial level of $1000 in 2013. The second move in relative terms is modest as it brought "only" 12,804%, while the price hit the level close to $20,000 in 2017. These two numbers provide us with data for the first valuable measurement. If we divide the second percentage progress (12,804%) into the first one (52,287%) and then round it up, we will get the ratio of 0.25x. I applied this ratio to the second move to get the projection for the current third move: 12,804% x 0.25 = 3,200%.
Only Pure Play on Colorado’s $2 Billion Cannabis Market
In 2014, Colorado became the first U.S. state to legalize recreational cannabis. Since then, sales have boomed, hitting a new all-time high of $2 billion in 2020.
See how to invest in this powerful trend with a secret cannabis stock that is one of the most undervalued in the industry.
Now we can find the target for the current move up, which started from $3,122. Believe it or not, but the projected destination point is located in the jaw-dropping $103,000 area. But in relative terms, it looks like fading growth compared to the blasting first move. Each growth angle confirms that; the first move has a sharp angle of 57° while the second one was less sharp with an angle of 40°. The current move is even flatter with an angle of only 30°.
That's not all; there is enough data to calculate the time range. The first move was faster and sharper as it took only 25 monthly bars to emerge compared to 35 monthly bars in the second move. It gives us an extension ratio of 1.4x (35/25). If we multiply that ratio to the second rise of 35 monthly bars, we will get 49 monthly bars for the current move up. I added it in the chart to measure the time target; it falls at the start of the next year (orange vertical line). The 78% of the time range already elapsed.
There are other interesting findings in this chart. The correction after the first move up almost reached the 88.6% Fibonacci retracement level, and the pullback followed the second move up. Coincidence? Imagine where bitcoin's price could crash after hitting $103,000 if this pattern continues... $15,000.
I am eager to see your thoughts; please share your comments below.
Intelligent trades!
Aibek Burabayev
INO.com Contributor, Metals
Disclosure: This contributor has no positions in any stocks mentioned in this article. This article is the opinion of the contributor themselves. The above is a matter of opinion provided for general information purposes only and is not intended as investment advice. This contributor is not receiving compensation (other than from INO.com) for their opinion.


Fallacies in analysis: The period of growth begins at the low in the base after previous run up, but the new third phase begins at the previous high. Beginning at the new low and assuming predictions are otherwise correct puts the new high in January 2023 area. Also price run up begins from this low instead of previous high which makes the target around 79,000 per BTC, again assuming predictions otherwise correct.
Eagle eye, Mr.Rogers.
The true peak falls on January 2023 area, indeed.
The price target of $103,000 is correct as it starts from the valley of $3,122, not from the peak.
Thank you for the heads up!
Dear readers, I am sorry for that.
Best wishes to all of you!
I expect that Bitcoin to reach 100K by the start of 2022. Due to more money be invested by wall street.
Possibly a pull back to $65K in 2022. Still a nice profit for those investing now.
Crypto is the future of money. It is still in it's infancy. It will continue to grow and become less volatile with large institutional adoption. It is also a store of value better than gold with a finite amount set into it's code. It is also more practical than gold as it can be easily moved, transfered and used as money. With its limited quantity and not being government controlled or backed, it is not inflationary.
is Trade Station a Good site to Buy Crypto Currencies