The broader indices have been in a raging bull market since the COVID-19 induced lows in March of 2020. The rally has been largely uninterrupted, with minor blimps in September and October before reaching all-time highs by early December. The initial rally was narrowly focused on technology and the stay-at-home economy stocks. With the improving vaccine prospects, November saw a sea change with broad market participation with value stocks breaking out with huge moves to the upside. To boot, massive stimulus coming out of Washington is being priced into the markets. All three major indices (S&P 500, Nasdaq, and Dow Jones) are at all-time highs. Are stocks overextended underpinned by irrational exuberance considering the damaging economic consequences that COVID-19 inflicted on the worldwide economy? Are markets getting ahead of themselves as investors bet on a return to normal for the global economy? Stretched valuations, options put/call ratios, broad participation, and P/E ratios may be potential warning signs of near-term pressures.

Fundamentals – Lofty P/E Ratios
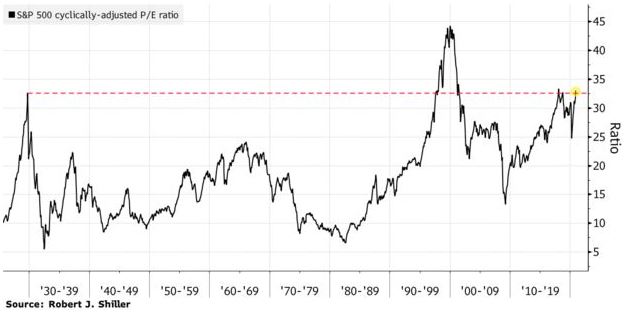
Price-to-Earnings ratios are largely discordant with the economic backdrop and at historically lofty levels. Outside of the tech bubble in 1999/2000, the current P/E ratio of the S&P 500 composite is the highest on record, exceeding that of the Roaring Twenties (Figure 1).

Figure 1 – S&P 500 P/E historical ratios
Put/Call Option Ratio
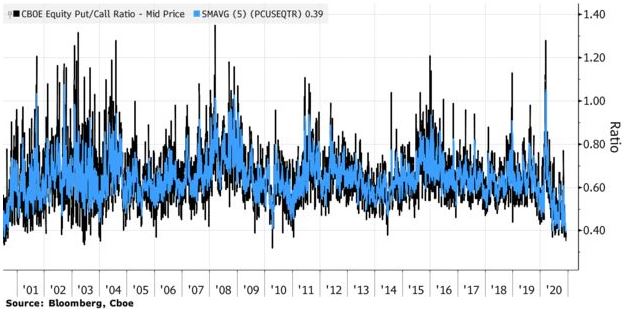
Options put/call ratio assess the volume of bearish put options relative to the volume of bullish call options. The ratio is at its lowest levels in 20 years, which may indicate irrational optimism by investors. The gauge can often be a contrarian signal for equity markets (Figure 2).

Figure 2 – 20 year put/call ratio data
All-Time Highs - All Major Indices
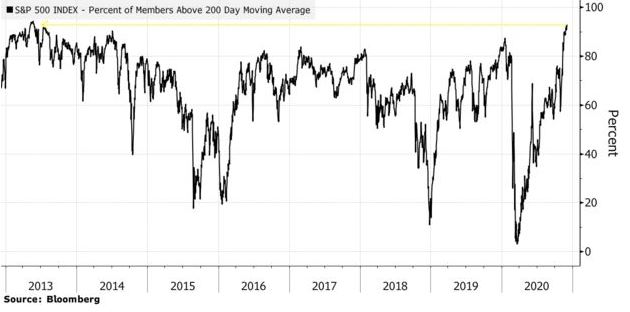
With the positive vaccine news coming into the fold, the Dow Jones, S&P 500, Nasdaq, and Russel 2000 are all at all-time highs. The equity rally has been very broad, so say the least, while early on in the recovery phase, the rally was narrowly focused on Nasdaq stocks. Almost every stock in the S&P 500 is in a technical uptrend (e.g., stocks trade above their 200-day moving average). Over 93% of stocks in the S&P 500 were trading in this technical uptrend after the first week of December, which is the highest in seven years (Figure 3).

Figure 3 – S&P 500 technical trends, the percentage of stocks above their 200-day moving average
Conclusion
We are in unprecedented territory as the COVID-19 backdrop continues to ravage countries worldwide and decimate entire industries. Vaccine approvals and administration of the vaccines are rolling out in the U.K., Canada, and emergency authorization in the U.S. The vaccine approvals provide certainty in uncertain times while investors are betting on a return to normal for the global economy. Stocks are ostensibly overextended underpinned by irrational exuberance. Stretched valuations, options put/call ratios, broad participation, and P/E ratios may be potential warning signs of near-term pressures. Investors should heed these historical comparators as 2021 comes into the fold
Thanks for reading,
The INO.com Team
Disclosure: The author holds shares in AAPL, AMZN, DIA, GOOGL, JPM, MSFT, QQQ, SPY and USO. The author has no business relationship with any companies mentioned in this article. This article is not intended to be a recommendation to buy or sell any stock or ETF mentioned.
