The plan posted at the end of November works amazingly well, so far as price accurately charts the preset pattern at least for the gold, which could offer a good trading opportunity soon.
Let us check the "King's" chart first to see what's happening.
I switched to a smaller time frame to focus on the current leg down, as we saw on the chart before.
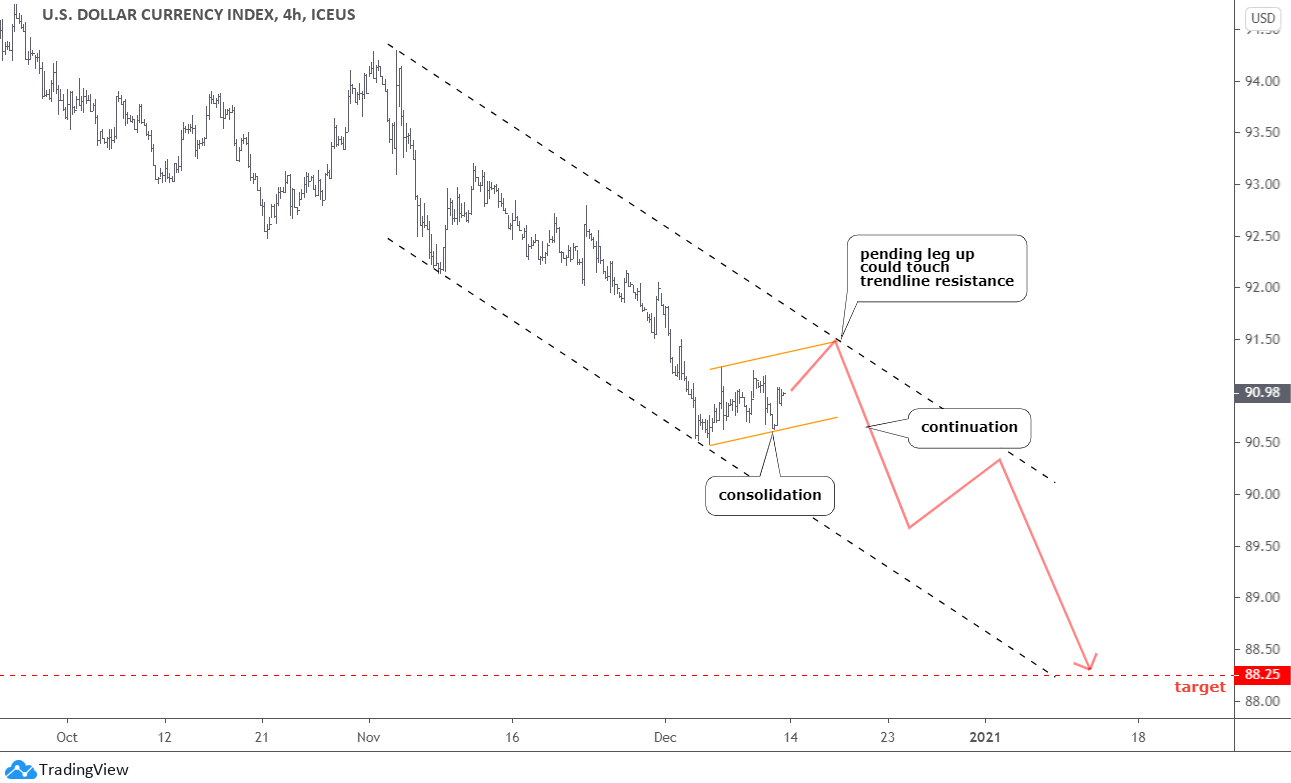
The U.S. dollar index (DXY) is building a slightly up-sloping sideways consolidation (orange channel). I think we can see another leg up to touch both the upside of the orange channel and the trendline resistance of the black dashed downtrend. This area around 91.5 would offer double resistance.
Once this consolidation completes, we could see the downside's continuation, as shown with the red zigzag down. The target area remains intact in the valley of the last large leg down at 88.25. Let us see if the power of trends could contain the current move down until the very end.
It is time to get to the "main dish" as it is almost ready. I am talking about gold, of course.
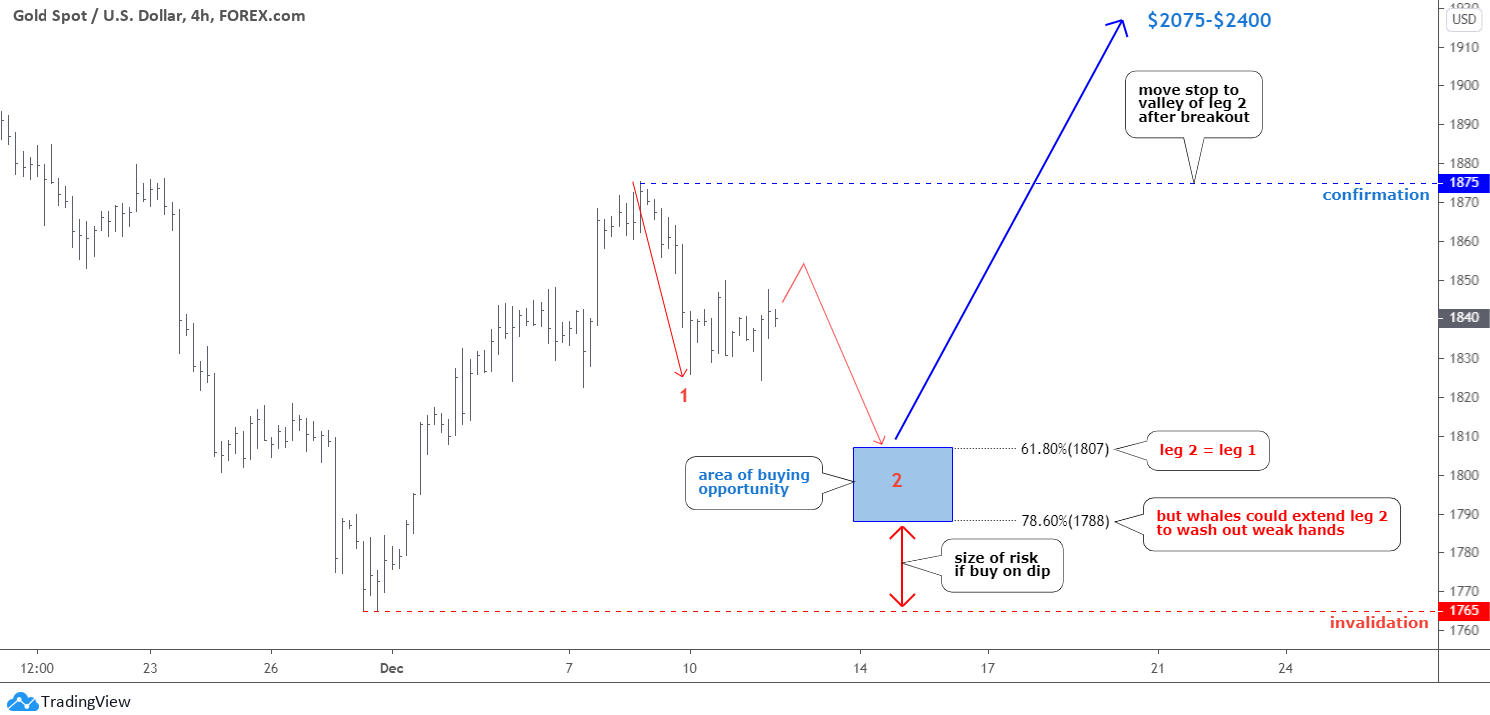
Gold has booked the first strong move up, and now we see a retracement, which could give an excellent chance to join the bulls. I think we have the first leg down of the corrective structure (red "1"). Now the market builds the junction between leg 1 and upcoming leg 2 within a sideways consolidation. We could see another spike higher in the $1850-1860 range before the move down resumes.
The Fibonacci retracement area (blue box) could help us pinpoint a buying opportunity area. The 61.8% sits at $1807, and the next 78.6% is located at $1788. The former coincides with the area where leg 2 is equal to leg 1, and this is how the magic of reading the structure works.
Why then should we consider the lower retracement level of 78.6%? The thing is that the finishing legs are quite often rapid, scary, and impulsive by nature. The so-called "whales" could take this chance to wash out "weak hands," forcing them to quit while buying their liquidation lower. Be careful.
The size of the risk of buying on the dip is equal to the distance between the entry-level in the blue box and the invalidation point, which is located in the valley of the growth point ($1765). Mind this before entry.
Cautious traders could enter only when the price will cross the peak of the former move up beyond the $1875. Those who will buy earlier on the dip should consider moving the stop loss to the valley of leg 2 to decrease the risk.
Most of your votes on the possible target area were split evenly between the old target of $2152 and the new Pitchfork based aim of $2400. It looks like you are ultra-bullish.
Now, let us see the updated silver chart.
Silver could be either a "dark horse" or a "wounded horse" as the structure was not properly completed. It could follow gold or build a Bearish scenario until the next structure emerges. Therefore, I will show you both paths on the chart.
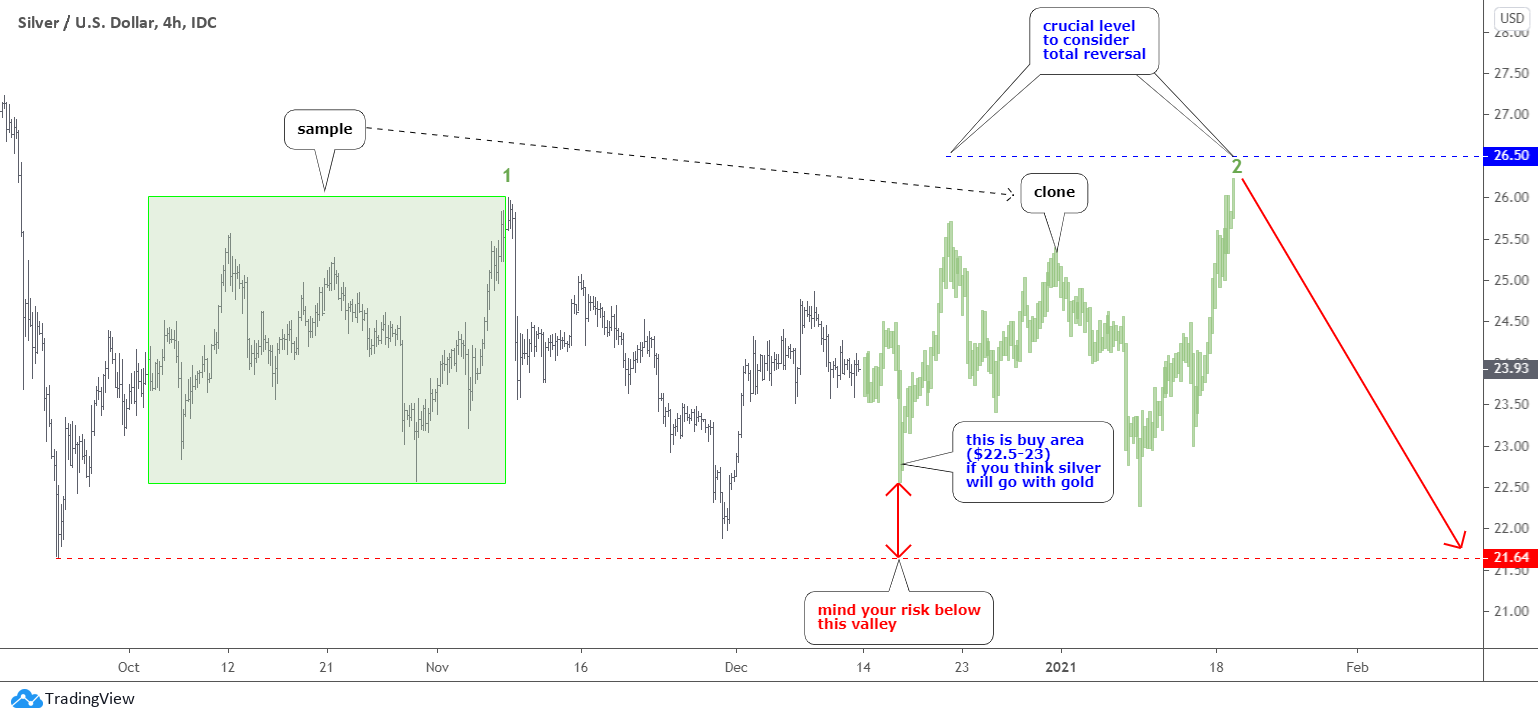
To elaborate on the bigger map with the Bearish scenario that I shared with you last time, I switched to a smaller 4-hour time frame. Sideways consolidations are typical, and quite often, the structure of the legs could repeat. That is why I cloned the green rectangle area of the first leg up to the right in a green bar pattern considering the time elapsed in leg 2.
The final point is located around $26.3. It means that we should watch closely how the price would behave in the area between $26 and $26.5 to see if this would be an end of consolidation or we will see the continuation beyond this area. If the price fails to overcome that barrier, then another leg down to tag the valley of $21.64 and complete the correction could start.
I saw that most readers think that silver will go hand in hand with the mighty gold. For that reason, I added the same buy setup as I prepared on the gold chart. The "buy on dip" area is located between $22.5 (78.6%) and 23.00 (61.8%). Consider cutting the risk below the former valley of $21.64.
Intelligent trades!
Aibek Burabayev
INO.com Contributor, Metals
Disclosure: This contributor has no positions in any stocks mentioned in this article. This article is the opinion of the contributor themselves. The above is a matter of opinion provided for general information purposes only and is not intended as investment advice. This contributor is not receiving compensation (other than from INO.com) for their opinion.


Thank you I appreciate your feedback, I am a small "pocket trader" I can see that by looking at the amount in my account compare to the value of a trade.
Since whales attacks weak hands I make the assumption that the whales can "see" the weak hands.
I will appreciate your comment
Dear Mr. Calitz,
It’s a big question whether they see weak hands or not. Some types like large banks definitely could see the flows and orders submitted. But the main point is that they just could stay longer in the game as big pocket allows.
Aibeck.....Aibeck, THE SLEEPER HAS AWAKENED! March Silver futures hit a high of $26.125 this morning!
Dear Ed, thank you for the heads up!
Let’s see how it will go further as gold also broke former top. Two paths are still intact )).
The gold should make a minor retracement soon and stay above former valley of $1818.
Those who didn’t enter could do it there with risk considered.
Are you a silver or a gold bug?
Best wishes, Aibek
I'm long both sliver and gold. I'm not sure if I am as fanatical as most "bugs" are. My faith in gold is waning (despite being long for now). If I must choose between the two I would say that I am more bullish/buggy on silver. In addition to silver being a store of value, the increased industrial use in the years to come (solar panels, batteries, other electronics), make silver more compelling than gold. I think BTC is also stealing some of the spotlight away from gold and that hurts the appeal of gold....but if BTC can be at $23,000 per coin, why can't gold be at $2,300 per oz?
Gold has to much competition from other investments to advance out of its trading range. looking for a set back in the markets to enter a long position. will watch the housing market , if we have a down turn, its a indication that the stock market will follow and in my opinion will increase interest in the gold market. remember gold has been in competition with many more interments now then in the past. Oh watch Bitcoin ? that's the wild card.
Silver is the sleeper. When the second stimulus bill is passed (perhaps while Trump is still President), and when the third stimulus is passed shortly after Biden is sworn in, and when the new administration implements green energy policies (solar and batteries use silver)...then the precious/industrial metal that is Silver will awaken! This time $30 will not be the top; it will go higher.
https://m.youtube.com/watch?v=Jc_xGu-9Jyk
Bummed that nobody appreciated the Dune clip.
Buy all you can now, fiat money is no good
Whales are big money people in gold also Central Banks
For weak hands how about people who sold when Dow was 20,000 and going down everyday.
Whales bought “ weak” hands sold
Thanks for article, great work, what is "whales"and "weak hands"?
Dear Mr. Calitz,
Thank you for a warm feedback. "Whales" are large market players, often institutional like central banks, investment banks, funds, etc. In the past, one of these types was blamed for rigging the price.
"Weak hands" usually means those retail/small investors with high leverage and too small "pockets" to survive "whales" attacks.
In a wild nature, the good example is orcas' hunting behavior - prey just can't escape large predators' concerted attack.
Best regards, Aibek
Any body have comments on the Gold/Zar graph? It looks to me the RAND from a country with many many problems is the "KING" not gold.