The collective mind of the Blog's readers has proved to be very powerful as the majority of you guessed it right last time, that the U.S. dollar index (DXY) will reverse down. My assumption that precious metals will start to grow also played out accurately so far, and one could get the clue of DXY reversal from the assumption mentioned above.
In this update, I added minor annotations for fine-tuning previous charts as I switched to a lower time frame of 4-hour. The final chart below will show you the background for the title of this post. Let us start with the DXY 4-hour chart.
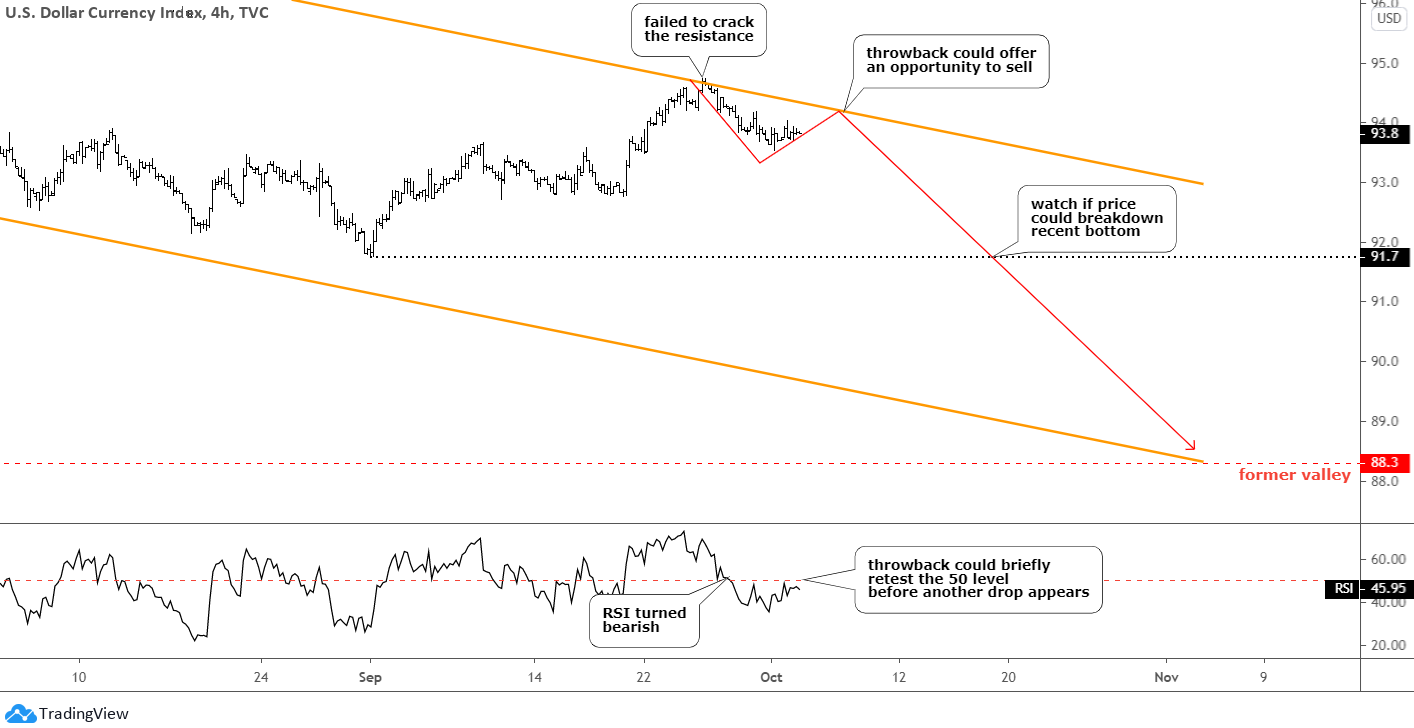
The market indeed saw that orange trendline resistance as the price reversed right at that point. The RSI turned bearish now as it broke below the crucial level of 50. The indicator raises its head together with the price, which could throwback to retest the resistance. The former could briefly overthrow the crucial level, and then it should drop below it again to confirm the Dollar's further weakness.
The timeline shows that the DXY could stay weak until the U.S. presidential election this November as uncertainty scares investors. The next strong support is at the recent bottom of 91.7.
The gold 4-hour chart follows.
The top metal slowly moves as planned as the price briefly reached $1917 by the end of the last week. The RSI jumped into the bullish area now, and the small consolidation has begun already. I highlighted it with the orange ellipse on the price chart. The gold should continue further growth after that. The next "make it or break it" level is only at $2016 (previous top). The majority of you voted for the price to reach that level, but then you chose for the gold to drop back to $1800, as the red down arrow shows.
The price will face strong support at the former low of $1848 on its way down. The invalidation trigger of the current move up is also located there.
The silver 4-hour chart is next.
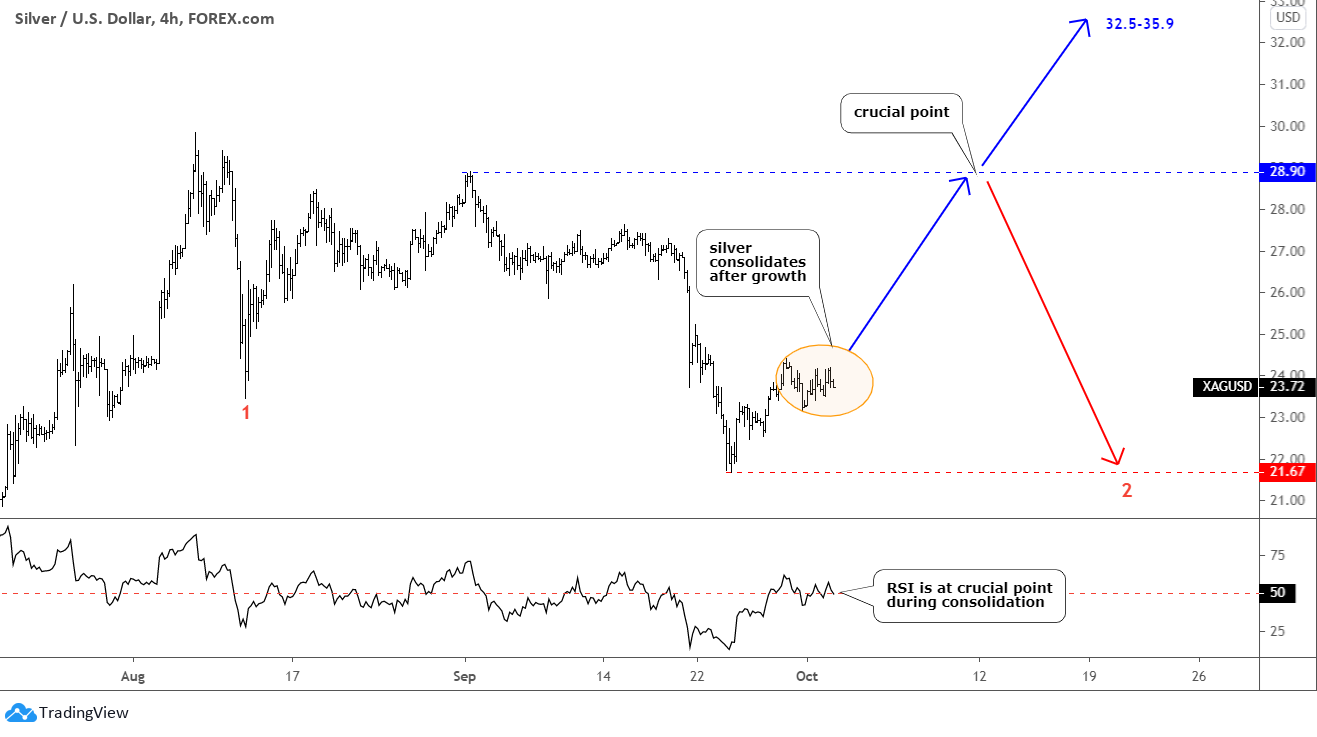
Silver was my navigator last time as I assumed the reversal to the upside in the precious metals looking at the clean chart of this wild metal. It advanced more than the gold did last week. The former scored almost 7% to the top, and the latter booked only 3%.
The silver chart remains clear, and on the lower time frame, we can spot a neat structure of a sideways consolidation with a possible extended pattern. Simultaneously, the RSI hovers around the crucial 50 level in the background, which also confirms a consolidation.
The majority of you bet that the price would grow first and then reverse down around $28.9 to complete a very complex corrective structure. The silver price moves as per our expectations so far. The invalidation trigger of the current move up is located in the area of the recent low of $21.67.
The "bonus track" is the update of the gold/silver ratio on the daily chart to show you why I think the top metal will beat the silver.
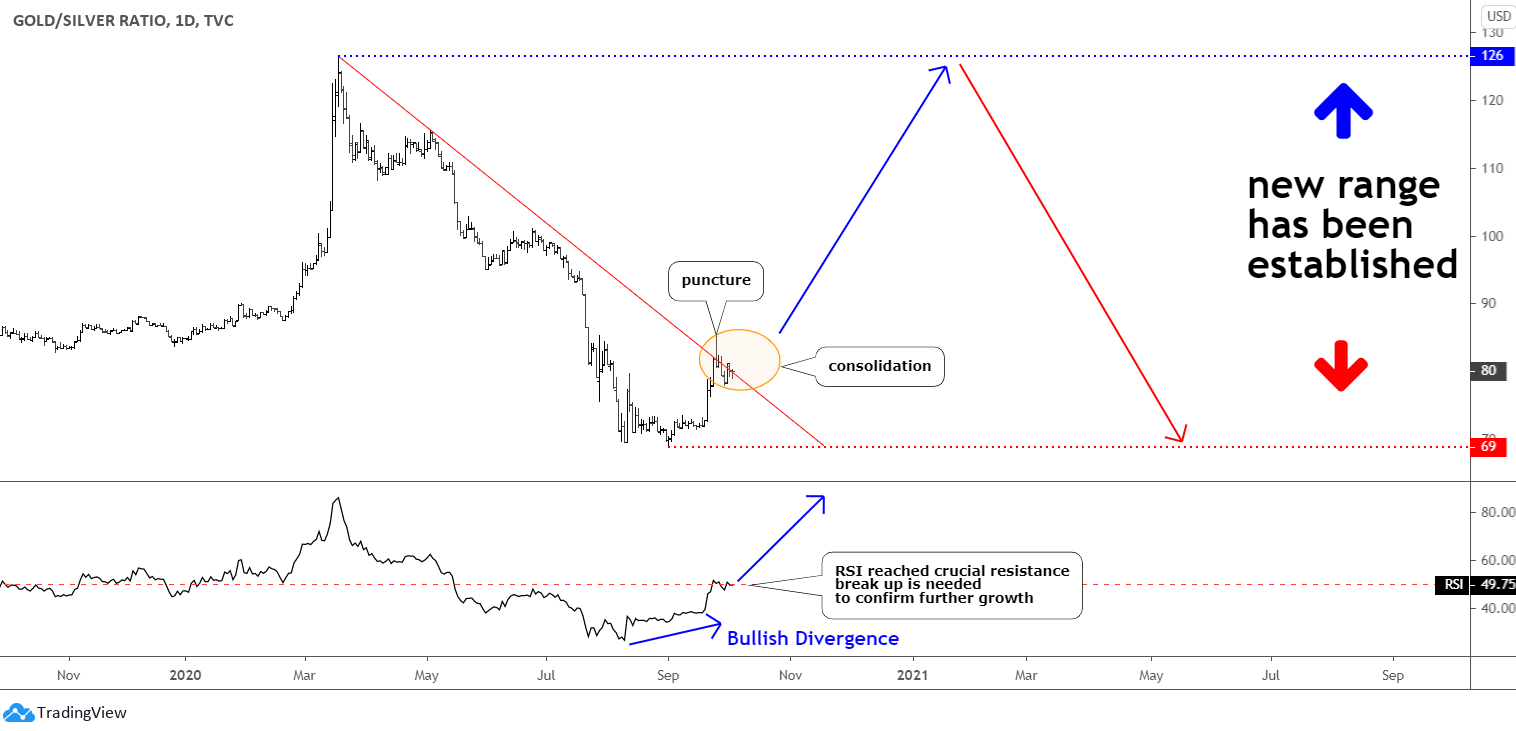
Last time, most of you voted that the ratio would not reverse to the upside when the reading was 93 oz. and you were right as it dropped much lower. The ratio could not overcome the red trendline resistance this summer, and it dropped huge to the 69 oz. Only in September, when the market smashed the silver harder than the gold against the Dollar, the ratio could puncture that resistance, and now it is consolidating right on the barrier. If you would look at the RSI sub-chart below, you could see that the Bullish Divergence preceded that strong move up as the ratio established a lower valley while the RSI, on the contrary, pinned a higher low.
Now, the indicator is also located at the crucial level as the ratio does. I think we will see some sideways consolidation before the ratio will resume the upside to tag the all-time high of 126 oz. The RSI should break above 50 as well.
The ratio established a new range between 69 and 126 oz. It halved its value within that range during just a half of a year, and it reached the deep 61.8% Fibonacci retracement level of the preceding growth. That could be enough for the range to remain intact in the medium term.
The up blue arrow and the next red down arrow are showing the "blue path" that most of you chose this past July.
Intelligent trades!
Aibek Burabayev
INO.com Contributor, Metals
Disclosure: This contributor has no positions in any stocks mentioned in this article. This article is the opinion of the contributor themselves. The above is a matter of opinion provided for general information purposes only and is not intended as investment advice. This contributor is not receiving compensation (other than from INO.com) for their opinion.


I Enjoy the charts and your commentary, and also the voting which gives me an idea of what investors are thinging
Dear Mr.Perez, thank you for stopping by and leaving a warm feedback here. Moreover, our readers like you quite often accurately predict the next move and it's amazing! Best wishes, Aibek
I agree that both gold and silver will continue move upwards. I'm having difficulty with an entry point, because both have been whipsawing up and down. Any advice as when to go long the DEC futures contracts?
Dear Ed, thank you for being active on the Blog as many have questions but a few ask it.
Your question shows the difference between analysis/forecasting and trading. One day, I would be happy to start the small column in my posts to discuss and exchange our experience in trading.
There are at least two ways/strategies to enter this type of consolidations.
1) Conservative/Confirmation based - we got sideways whipsawing and entry is planned on the break up of that range (>$1925 gold dec2020; >$24.7 silver dec 2020), better on the pullback to the broken resistance
2) Picking bottom/Guessing - waiting for the second leg of correction to unfold and pick it up there (around $1890 gold dec 2020; $23.2 silver dec 2020)
It should be like this: Forecast => Strategy/Entry point = > Risk+Money management => Position management (watch if your plan plays out or not/exit).
Good luck! Aibek
You're welcome Aibek; I like to chat with other commodities people! Gold & Sliver got a surprise beat-down today. We are pretty close to those figures you note in item 2). Maybe we are there now!