
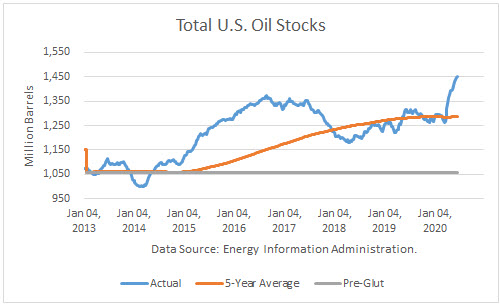
According to the Energy Information Administration (EIA), U.S. petroleum inventories (excluding SPR) built by 5.9 million barrels last week to 1.451 billion, whereas SPR stocks built by 1.4 million. Total stocks stand 163 mmb above the rising, rolling 5-year average and about 151 mmb higher than a year ago. Comparing total inventories to the pre-glut average (end-2014), stocks are 392 mmb above that average.
Crude Production
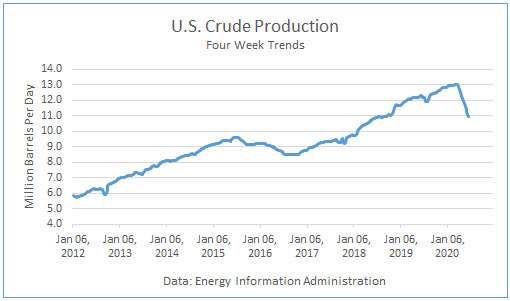
Production averaged 11.0 mmbd last week, up 500,000 b/d from the prior week, and 10.950 mmbd over the past 4 weeks, off 10.6 % v. a year ago. In the year-to-date, crude production averaged 12.311 mmbd, up 1.7 % v. last year, about 200,000 barrels per day higher than a year ago.
Other Supply
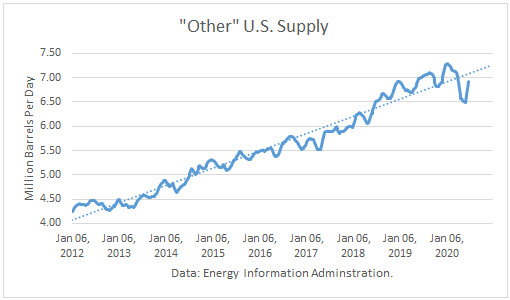
I have previously noted in an article how the “Other Supply,” primarily natural gas liquids and renewables, are integral to the petroleum supply. The EIA reported that it rose by 68,000 b/d v. last week at 7.075 mmbd. The 4-week trend in “Other Supply” averaged 6.917 mmbd, off 1.3 % over the same weeks last year. In YTD, they are 1.1 % higher than in 2019.
Crude production plus other supplies averaged 17.867 mmbd over the past 4 weeks, well below the all-time-high record.
Crude Imports
Total crude imports fell by 102,000 b/d last week to average 6.540 mmbd last week. This figure was below the EIA 4-week trend of 6.556 mmbd, which in turn was off 11.6 % from a year ago.
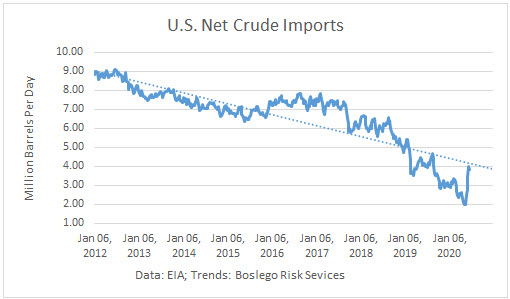
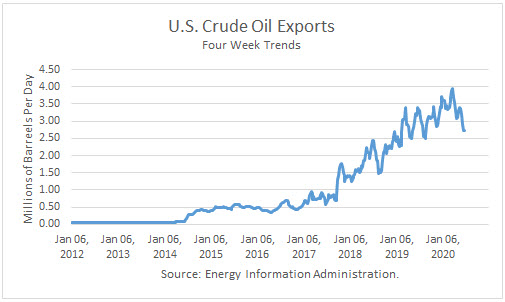
Net crude imports fell by 797,000 b/d, and exports rose by 695,000 b/d to average 3.157 mmbd. Over the past 4 weeks, crude exports averaged 2.713 mmbd, 20.3 % lower than a year ago.
U.S. crude imports from Saudi Arabia fell by 25,000 last week to average 1.381 mmb/d. This reflected the surge in Saudi exports to the U.S., which began in late March after the price was began between the Saudis and Russians. They had reportedly sent an armada of tankers carrying up to 50 million barrels to flood the U.S. market. Over the past 4 weeks, Saudi imports have averaged 1.472 mmb/d, up 221 % from a year ago.
Crude imports from Canada rose by 144,000 b/d last week, averaging 3.229 mmbd. Imports over the past 4 weeks averaged 3.031 mmbd, off 16.1 % v. a year ago.
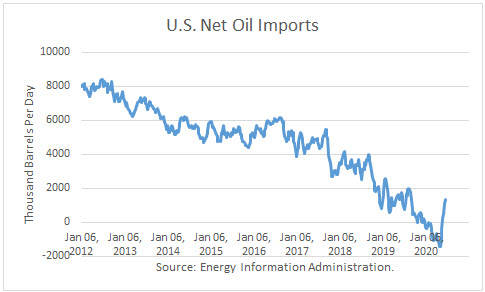
Net oil imports averaged 1.273 mmb/d over the past 4 weeks. That compares to net oil imports of 1.143 mmbd over the same weeks last year. This is the fifth 4-week period this year that imports exceeded exports.
Crude Inputs to Refineries
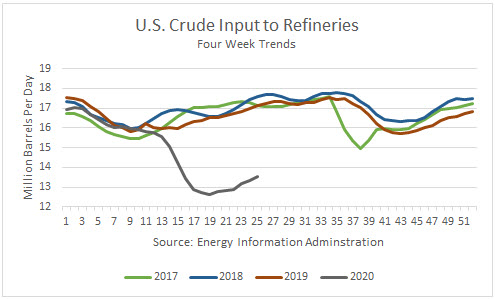
Inputs rose by 239,000 b/d last week last week averaging 13.840 mmbd. Over the past 4 weeks, crude averaged 13.558 mmbd, off 21.0 % v. a year ago. In the year-to-date, inputs averaged 14.566 mmbd, off 11.6 % v. a year ago.
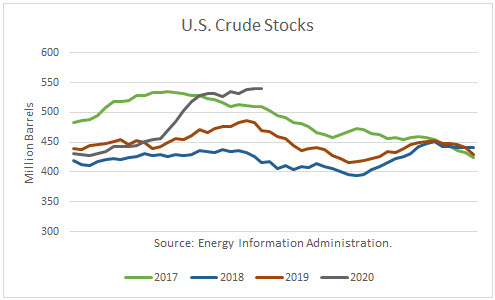
Crude Stocks
Over the past 4 weeks, crude oil supply exceeded demand by 581,000 b/d.
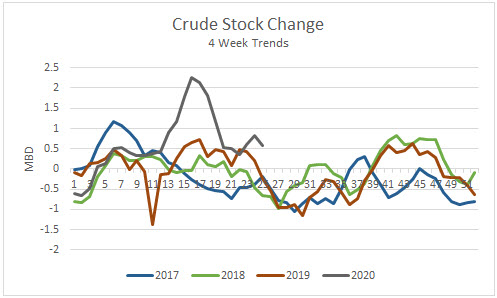
Commercial crude stocks 540.7 mmb are now 71.1 million barrels higher than a year ago.
Petroleum Products
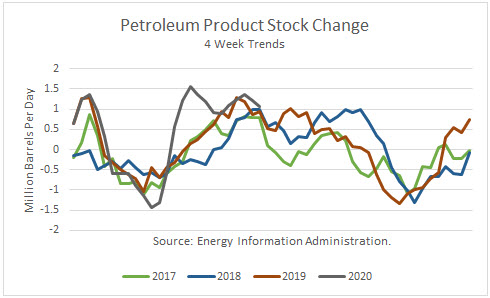
Given the recent net product stock builds, product supply has exceeded demand by 1.056 mmb/d.
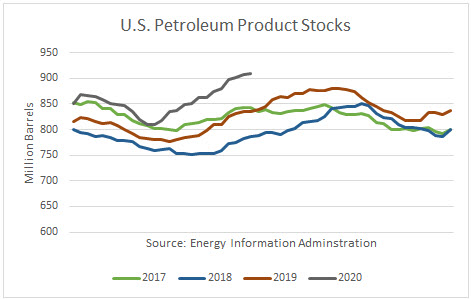
Total U.S. petroleum product stocks at 910 mmb are 75 million barrels higher than a year ago.
Product exports rose by 276,000 b/d last week, averaging 4.629 mmbd. The 4-week trend of 4.436 mmbd is off 13.2 % from a year ago. In the year-to-date, exports averaged 5.114 mmbd, up 0.4 % from a year ago.
Demand
Total petroleum demand averaged 17.069 over the past 4 weeks, off 17.0 % v. last year. In the YTD, product demand averaged 18.112 mmbd, off 11.8 % v. the same period in 2019.
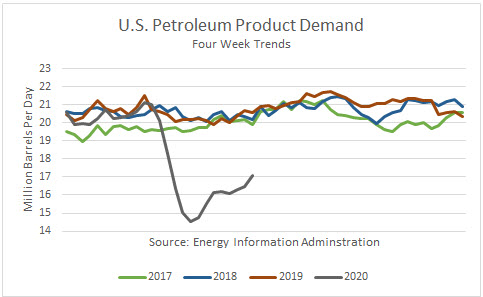
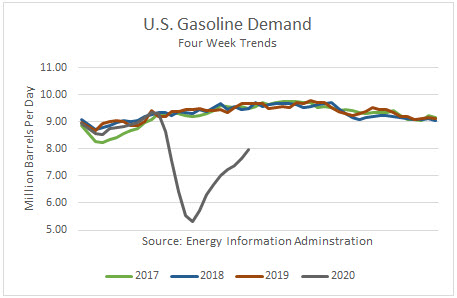
Gasoline demand at the primary stock level rose by 738,000 b/d last week and averaged 7.982 mmbd over the past 4 weeks, off 17.5 % v. the same weeks last year. In the YTD, it reported that gas demand is off 16.0 % v. a year ago.
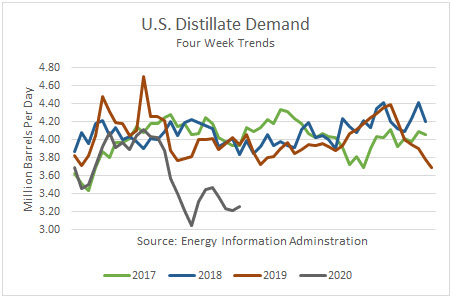
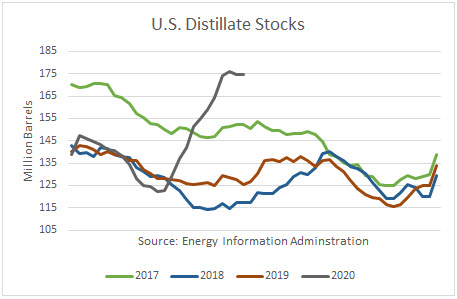
Distillate fuel demand, which includes diesel fuel and heating oil, fell by 89,000 b/d last week, and averaged 3.260 mmbd over the past 4 weeks, off 17.4 % v. the same weeks last year. In the YTD, demand is off 10.8 % v. a year ago.
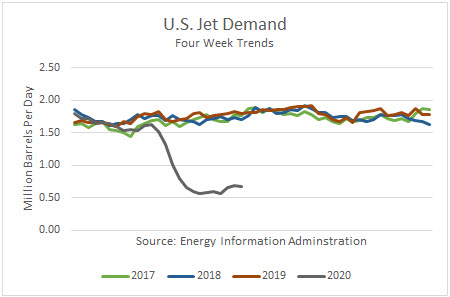
Jet fuel demand is off 62.5 % over the past 4 weeks v. last year. In the year-to-date, demand was off 35.8 % v. 2019.
Product Stocks
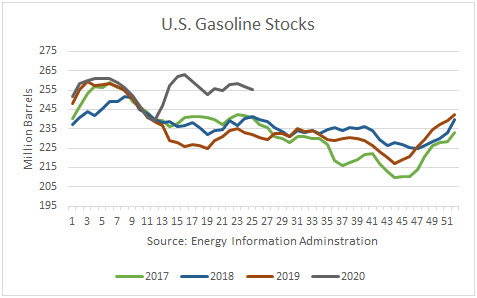
Gasoline stocks are now 23.1 mmb higher than a year ago, ending at 255.3 mmb.
Distillate stocks are 49.3 mmb higher than a year ago, ending at 174.7 mmb.
Conclusions
Improving petroleum product demand and crude oil demand at refineries have still yet stopped the rise in U.S. oil inventories. Crude and product stock build rates remain very high.
Recent reports indicate that shale oil companies may re-start shut-in wells above $30/b. Since the market has reached the upper $30s, we may see the downturn in U.S. crude production reversing soon. That would be a very negative development for oil prices, and this week’s major rise in crude production appeared to support that view.
Check back to see my next post!
Best,
Robert Boslego
INO.com Contributor - Energies
Disclosure: This contributor does not own any stocks mentioned in this article. This article is the opinion of the contributor themselves. The above is a matter of opinion provided for general information purposes only and is not intended as investment advice. This contributor is not receiving compensation (other than from INO.com) for their opinion.