Last time I updated the gold chart at the beginning of the year I focused on the long-term consolidation, which has started at the end of 2015 and has a tricky structure as all corrective stages do. I shared with you the three most feasible options of structure development.
The first one implies the straight move up beyond the former top of $1375 (blue labels), it took only 22% of your likes. The second option, which you liked the most (48%), offers triangular consolidation (green labels). The third alternative (red labels) gained 30% of your support, and it could bring gold back down to retest $1122 area before it goes up.
I am proud to have such smart readers of my posts as most of the time you accurately predict the market behavior as last time you did it with a Santa Claus rally of precious metals. These days I spotted one notorious pattern, which could terminate the first option, which collected the least support from your voting, that amazes me again and again.
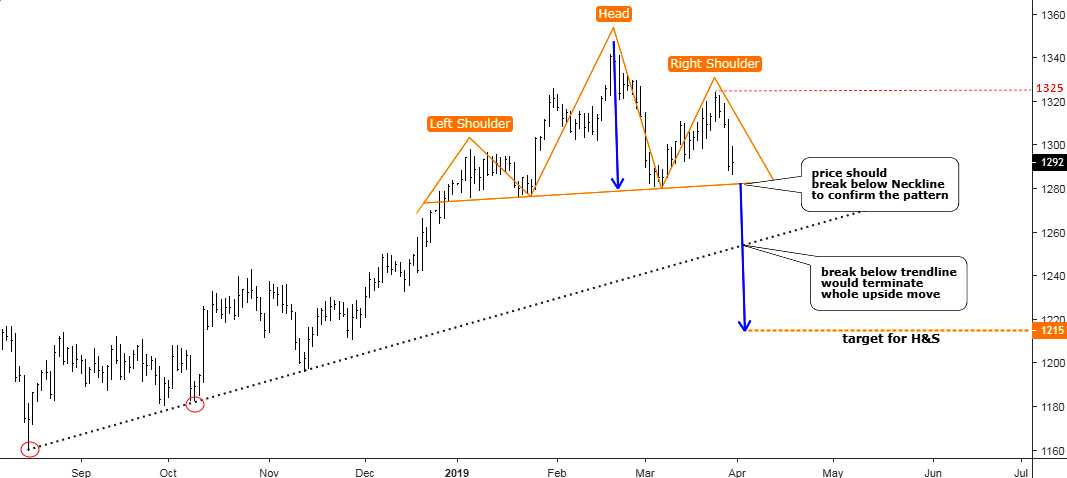
Gold Daily Chart: Possible Head And Shoulders Pattern

Chart courtesy of tradingview.com
The daily chart above highlights the upside move that started in the middle of last August. This is that very move, which has rallied at the end of last year and peaked at the end of this February at the $1347 confirming your take of Santa Claus Rally.
We got three peaks on the chart, and the central one is the highest. The valleys under that tallest peak are located almost at the same level. This combination could shape a Head And Shoulders pattern (orange labels) which is a reversal pattern. The market has been finishing the Right Shoulder as the price approaches the crucial support of the so-called “Neckline.” It is located at the $1281 level, and price should break below it to confirm the pattern.
The target for this pattern is located at the distance of the height of the Head (blue left down arrow) subtracted from the breaking point of the Neckline. The simple mathematical calculation points in the $1215 level as the target (blue right down arrow).
The trendline support (gray dotted), which was built through the valleys of August and October 2018 (red circles) offers strong support, and it is located halfway to the target. It could put a barrier for the drop. But if the gold price would break below it, then the market will get the confirmation of the termination of the whole move up started last summer.
The termination point for the reversal Head And Shoulders pattern is located at the top of the Right Shoulder at the $1325 (red dotted line). So the current game is in the range between $1281 and $1325. Let’s see live and see how it goes.
Intelligent trades!
Aibek Burabayev
INO.com Contributor, Metals
Disclosure: This contributor has no positions in any stocks mentioned in this article. This article is the opinion of the contributor themselves. The above is a matter of opinion provided for general information purposes only and is not intended as investment advice. This contributor is not receiving compensation (other than from INO.com) for their opinion.

The more symmetrical the shoulders are the better the formation is.
In this case the left shoulder is much lower than the right. The shoulder's tops differ a lot from each top to the head's top.
33mm left and 23mm right.
However I agree the three touch support line going back to last August would be a major concern if it is penetrated.
Actually, of course I see the pattern
However, I also firmly believe that Trump's agenda includes returning us to the Gold Standard as a way to increase Trade by devaluing the US Dollar to lessen its very strong position on world markets increasing Trade in dollars on the world markets, i.e, particularly trade in the US of course
IF Trump return us to the gold standard which he should and likely will, the price per ounce of gold should skyrocket, obviating your chart patterns.Admittedly however, whether or not Trump return us to the gold standard which no President has attempted to do since Nixon took us off the gold standard, is entirely speculative at this point.