Options can be a great strategy under any market condition as a standalone method or in conjunction with a long-term portfolio to augment long-term positions. Options trading can mitigate risk; provide consistent income, lower cost basis of underlying stock positions and hedge against market movements while maintaining liquidity. Risk mitigation is particularly important given the market wide sell-off throughout October and into November. Maintaining liquidity via maintaining cash on hand to engage in covered put option selling is a great way to collect monthly income via premium selling. Put option selling can also serve as a means to initiate a position via being assigned shares strategically. Heeding critical variables such as historic and implied volatility, implied volatility as it relates to historic volatility along with probability and liquidity, one can optimize option selling to yield a high probability win rate over the long term given enough trade occurrences. I’ll discuss these critical elements and how they translate into high probability options trading to maximize option outcomes regardless of directionality, effectively maintaining a market neutral position. In the end, options are a bet on where the stock won’t go, not where it will go and collecting premium income throughout the process.
Put Options Overview
Covered puts can be implemented as a means to leverage cash on hand to sell options contracts and collect premium income in the process. Contractually, this type of option selling gives the option buyer the right to sell you (the seller) shares at an agreed upon price by an agreed upon date in exchange for a premium (cash payment). An account cash reserve can be utilized for selling covered puts thus not purchasing the underlying security with the end goal of never being assigned shares and netting premium income in the process. It’s important to bear in mind that covered puts shouldn’t be sold unless one wouldn’t mind being assigned shares in the underlying equity if the underlying moves opposite the option directionality and breaks through the option strike price. Additionally, restricting covered put contacts to high quality, large-cap, dividend-paying companies with high implied volatility, high implied volatility percentile and high probability of success (i.e., one standard deviation out of the money) will mitigate risk and decrease the likelihood of assignment to maintain liquidity and add to cash on hand. The end goal is to capture premium income and maintain liquidity which is accomplished before the expiration of the contract via buy-to-close to accelerate the closure of the contract and capture realized gains.
Simple Statistics - Probabilities Regardless of Directionally
Stocks by default are binary investments that either move higher or lower with a 50:50 probability moving in either direction (with a slight positive trend bias over time). The broader market has moved in the negative and positive direction in equal occurrences and magnitudes. This 50:50 probability is in contrast to options trading which can be skewed in one’s favor to place the probability of success in his favor. Markets and the stocks that comprise these markets behave in a normal pattern of distribution (bell-shaped curve, Figure 1).
This normal distribution deviates from its mean over time out to 3 standard deviations. This distribution with three standard deviations encompasses 99.7% of all possible outcomes in any direction over a given timeframe. Regardless of directionality, one standard deviation accounts for 68.2% of all future price moves while two standard deviations account for 95.4% of all future moves and so on (Figure 2). Options can be structured in such a manner that places odds in your favor. Selling a put contract at one standard deviation out of the money yields a greater than 80% success since 68.2% resides within the one standard deviation and 13.6% remains in the second standard deviation in the positive direction of probability. Sticking with 2 standard deviations and not assuming any outliers, 100% of all stock movements less the second standard deviation in the positive direction and less the one standard deviation in both directions we arrive at an 82% probability of the stock not moving below this price (100% - (68.2% + 13.6%)) (Figure 3). Take away here is that stocks move in a predictable, normal distribution over the long term.
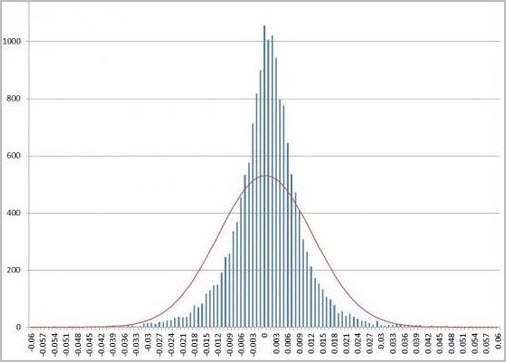
Figure 1 – Normal distribution response of the S&P 500 returns and number of occurrences in each direction and magnitude of moves from 1950-2014. Each bar represents a number of days the index has logged these returns.
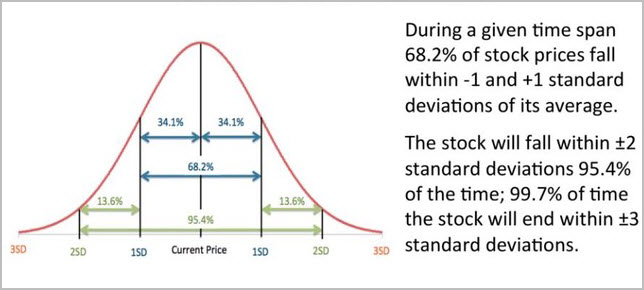
Figure 2 – Normal distribution and probabilities of stock moves adopted from tastytrade
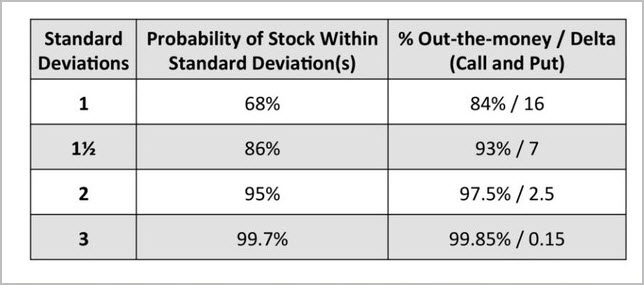
Figure 3 – Probabilities of stock movements falling within standard deviations and the corresponding probability of the stock trading out of the money upon expiration of the option contract. Adopted from tastytrade
Leveraging Volatility As An Edge
Now that probabilities have been covered, historic and implied volatility are key metrics that enable greater probabilities of success when selling options. Historic volatility (HV) is a measure of past stock movements whereas implied volatility (IV) is the markets’ estimated stock movement in the future or projected volatility. Implied volatility is the prediction of future stock moves, based on past stock moves, the magnitude of moves and market participants’ estimates via option pricing. Implied volatility is nearly always overestimated regardless of asset class relative to historical data. This overestimation can be leveraged to an option seller’s advantage.
Comparing current IV (projected stock move) to HV, one can assess where IV stands about HV. If HV was 20% for a $100 stock, then the stock moved between $80 and $120 over the past 52 weeks. However, IV may be estimated at 30% ($70 - $130 range) and since IV is nearly always overestimated this difference provides an edge. Essentially, once IV reaches the outer range of HV, then reversion to the volatility mean will occur since IV will rarely exceed HV despite the prediction that IV will exceed HV.
Here’s where IV percentile comes into play, the IV percentile is a measure of current implied volatility as it relates to the HV. If IV percentile is 75%, that means the current IV value is higher than 75% of all previous volatility values over the past 52 weeks. Thus if the stock normally trades below this implied volatility level 75% of the time then options are richly priced since the expectation of stock movement is high over the given time frame.
This is a measure of absolute mean deviation so the stock could be moving in any direction. Since IV is nearly always overestimated, it is unlikely that the stock will reach the IV of 30% thus remain near its historic boundaries of 20% HV. The spike in volatility provides option contracts with rich premium thus serves as great opportunities for option selling. Stocks can temporarily become highly volatile with the expectation that this volatility will decrease in these high IV percentile situations. One can take advantage of this edge. Any IV percentile above 50% provides options with rich time premiums that can be leveraged by option sellers. Since the stock will unlikely become more volatile than the upper range of HV, option selling becomes advantageous. Rich premiums can be paid out to option sellers with the expectation that volatility will revert to its mean allowing the option to decrease in value and expire worthless at expiration even if the underlying stock moves sideways or down without breaking through the strike price in a high probability manner.
Full Circle - Probability, Volatility, and Premium
Using a high implied volatility stock that’s highly liquid with a high IV percentile such as Tesla (TSLA) will be utilized as an example. Tesla was trading at $257 at the time of this article and using the probability calculator; Tesla only had a 3% probability of trading below $150 over the next month at just outside one standard deviation (Figure 4). Additionally, Tesla’s IV percentile was 100 meaning that the stock was trading with an IV that was higher than 100% of all HV values translating into rich option premium and propensity to revert to its HV mean (Figure 5). One month option contracts are listed in the option chain where a $150 strike price is paying out $3.62 per share or $362 per contract (Figure 6). If leveraging cash on hand this equates to 2.4% return on capital ($3.62/$150) over a one month period assuming the contract expires worthless and the shares do not break through the strike of $150 during the contact span (Figure 6 and 7).
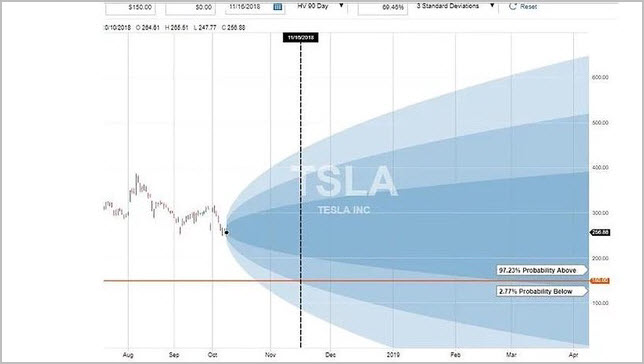
Figure 4 - Tesla’s probability of trading ranges with standard deviation cones highlighted and the probability of trading above $150 strike at expiration
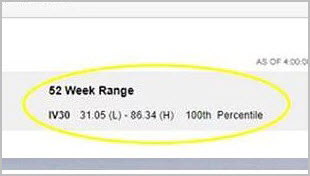
Figure 5 – IV Percentile highlighted at 100, which means that all past volatility values have traded below the current IV implying richly valued and overpriced option contracts
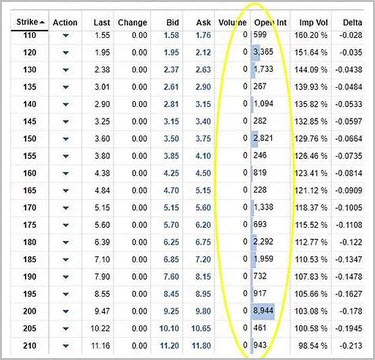
Figure 6 – Tesla’s option chain for out-of-the-money put options highlighting ~2 standard deviations at $150 strike price and the liquidity of Tesla options
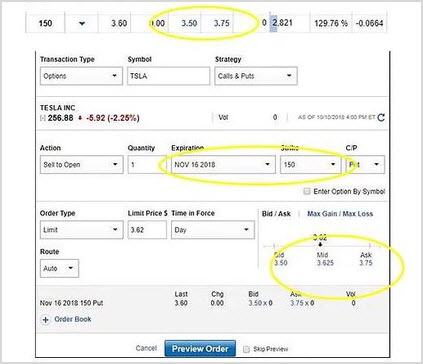
Figure 7 – Put option sale at $150 strike for a one month contract with a premium income of $3.65 per share or $365 per contract
Outcomes
If the shares move in your favor (in this case the shares appreciate in value or trade sideways) the put seller has optionality where he can buy-to-close the contract at a profit or allow the option to expire worthless. Time decay is on your side through the contract lifespan so every day that passes, the option seller will gain value due to time premium evaporating. If the shares trade positive, sideways or decrease (without breaking through the strike of $150), then option gains are in the seller’s favor. Tesla is a highly volatile stock, so a good rule of thumb is to buy-to-close the contract early in its lifespan when profits are 50% or greater. Additionally, a wide array of options in different sectors with different expiration dates will ensure portfolio diversity and plenty of opportunities to take profits and repurpose those funds (Figure 8).
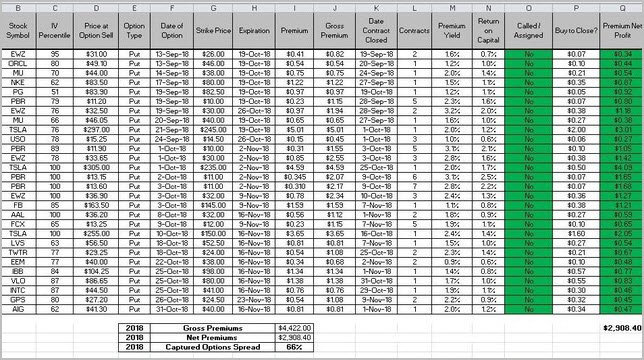
Figure 8 – A subset of recent option contracts that I’ve sold and subsequently executed a buy-to-close to realize gains in September. I accelerated the closure of these contracts in the latter part of September despite expiration in October
Conclusion
Options can be leveraged in a variety of ways to maintain liquidity, strategically initiating a position and capturing premium income. Here, I’ve discussed that selling options in the ideal environment of high implied volatility, high IV percentile, probability, and great liquidity will provide rich option premium selling as these underlying stocks revert to their means. As volatility decreases, the option contract will decrease in value providing the option seller with realized gains. Taken together, this translates into high probability options trading to maximize option outcomes regardless of directionality.
Thanks for reading,
The INO.com Team
Disclosure: The author does not hold any shares of the companies mentioned however may engage in option selling on some of the mentioned underlying stocks. The author has no business relationship with any companies mentioned in this article. This article is not intended to be a recommendation to buy or sell any stock or ETF mentioned.
