What's changed since stocks cratered and made a low in early February? There are few signs that monetary easing in China, Europe and Japan is helping pull the global economy out of a slump. It seems like the Fed has run out of ideas to jump-start the US economy, and like the other world central banks, has no more tricks in their bag. That is the backdrop of what is going on for world stocks this morning.
Here's what I'm watching today.
Dow
One area I'll be watching very closely today is 16,991.29. That level was last Friday's opening and I would view a close below that area as an indication of further weakness in the DOW (INDEX:DJI). At the moment, the Trade Triangle technology is in a trading range with a green weekly Trade Triangle and a red monthly Trade Triangle.
S&P 500
Like the DOW, the S&P 500 (CME:SP500) is in a trading range based on a conflict between the weekly Trade Triangle which is green and the monthly Trade Triangle that is red. This type of conflict creates a trading range environment and choppy trading conditions. One key level I'm zeroing in on is 1,994.71 which was hit last Friday. A close below that area could create more downward pressure.
NASDAQ
Out of the three indices, the NASDAQ (NASDAQ:COMP) has had the least amount of strength in this current counter trend rally. Like the DOW and the S&P 500, the NASDAQ is in a broad trading range. The level I'm keying in on today is 4,690.88, a close below that level will indicate a further pullback.
Gold
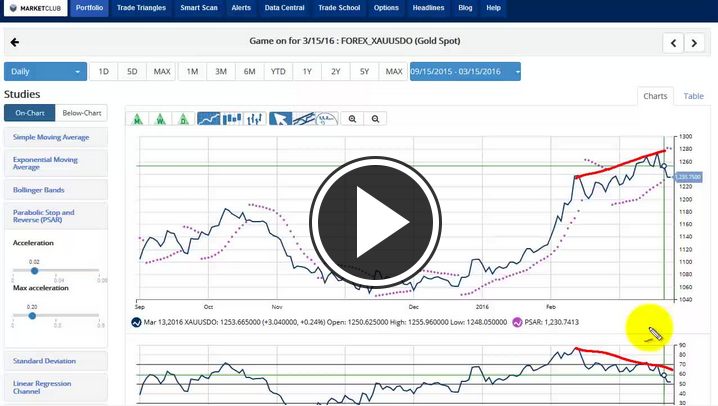
Once again gold (FOREX:XAUUSDO) is being pulled back down to the 50 support line of the RSI indicator. I expect to see gold find good support at or near this important support line. Based on the Trade Triangle technology, gold is presently on the sidelines. Longer term I remain positive on gold. Watch the RSI line for the next few days and when you see the daily Trade Triangle turn green, buy.
Crude Oil
The Trade Triangle technology signaled an exit at $37.21 on the April contract. This produced a healthy 70% profit on this trade. Crude oil (NYMEX:CL.J16.E) is now in a trading range and on the defensive. Currently, the RSI indicator is trading at 56.57, look for good support to come in at the 50 line on the RSI. I expect to see crude oil on the defensive for the next several days. Watch the RSI support level and the daily Trade Triangle for a buy signal.
Stay focused and disciplined.
Every success with MarketClub,
Adam Hewison
President, INO.com
Co-Creator, MarketClub


Thanks for being so sure the market would roll over. Now it has broken out and people are under positioned for the S&P move to 2500.
You can miss lead "Short Term"..............................
..............................Quite difficult, but not impossible to manage "Medium term" illusion
but...but...but....never manipulate "Long Term" so far.
The Fed jumped the gun on interest rate increase. It continues to aid the economy with low interest rates, however. One of the problems is that financial institutions are not passing those low interests rates on to consumers for the most part. Of course the industry needs more regulation, but it won't happen with Murka still in belief of the reactionary right.